OPEN-SOURCE SCRIPT
Daily ATR Bands
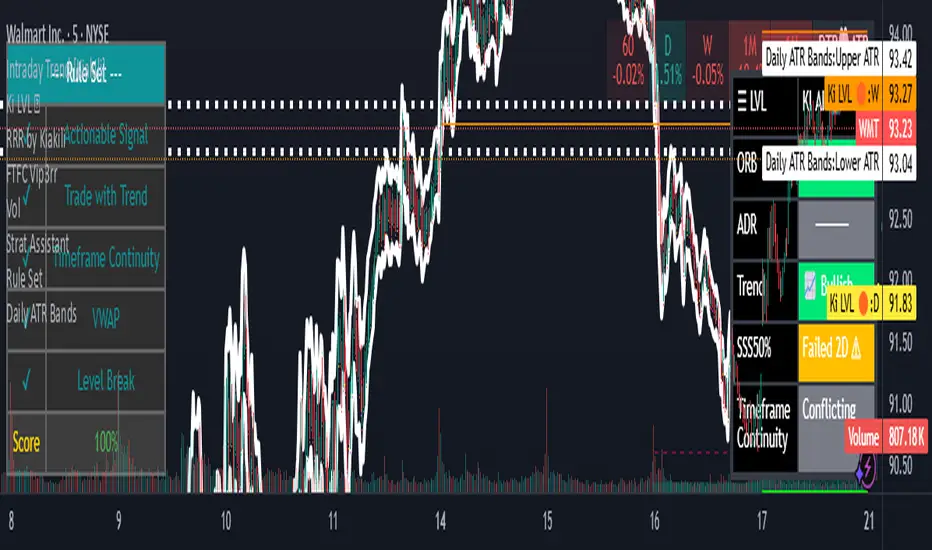
ATR Finder – Volatility Scanner for Smarter Trade Setups
The ATR Finder is a precision tool designed to help traders quickly identify high-volatility assets using the Average True Range (ATR) – a key metric in assessing market momentum and potential breakout zones. By automatically scanning and highlighting tickers or candles with elevated ATR values relative to their recent historical range, this indicator helps you filter for setups that are more likely to experience significant price moves.
Whether you're a day trader seeking intraday momentum or a swing trader looking for setups with strong follow-through potential, the ATR Finder cuts through the noise and visually signals which assets are "on the move." It can be paired with other indicators or price action tools to create a high-conviction trading strategy focused on volatility expansion.
Key Features:
Dynamic ATR Calculation over a user-defined period
Visual Alerts or Color-Coding for above-threshold volatility spikes
Supports Multiple Timeframes for both short- and long-term volatility analysis
Great for spotting breakout opportunities, gap continuations, or trend reversals
Use the ATR Finder to stay ahead of price action and build a watchlist that moves with purpose. Perfect for scalpers, breakout traders, and anyone who respects the power of volatility.
オープンソーススクリプト
TradingViewの精神に則り、このスクリプトの作者はコードをオープンソースとして公開してくれました。トレーダーが内容を確認・検証できるようにという配慮です。作者に拍手を送りましょう!無料で利用できますが、コードの再公開はハウスルールに従う必要があります。
免責事項
この情報および投稿は、TradingViewが提供または推奨する金融、投資、トレード、その他のアドバイスや推奨を意図するものではなく、それらを構成するものでもありません。詳細は利用規約をご覧ください。
オープンソーススクリプト
TradingViewの精神に則り、このスクリプトの作者はコードをオープンソースとして公開してくれました。トレーダーが内容を確認・検証できるようにという配慮です。作者に拍手を送りましょう!無料で利用できますが、コードの再公開はハウスルールに従う必要があります。
免責事項
この情報および投稿は、TradingViewが提供または推奨する金融、投資、トレード、その他のアドバイスや推奨を意図するものではなく、それらを構成するものでもありません。詳細は利用規約をご覧ください。