PROTECTED SOURCE SCRIPT
BASED Momentum Oscillator
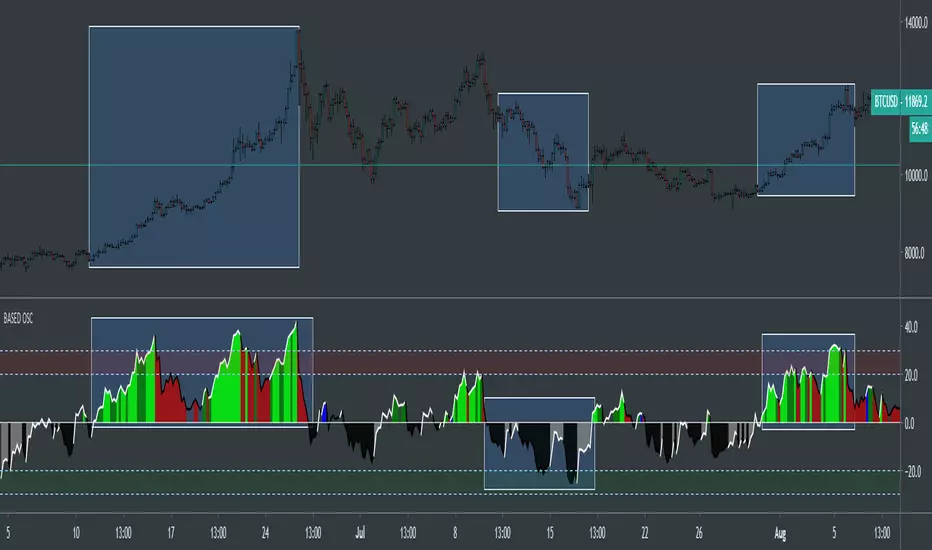
This is the BASED Momentum Oscillator. I have been working on this for awhile and it's been working really great! Can be used on any security on any timeframe. Spot entries during a bullish or bearish trend, oversold and overbought conditions, can be used to spot divergences.
When the oscillator reaches the red area on top, it means the security is entering overbought conditions. When the oscillator reaches the green area at bottom, it means the security is entering oversold conditions.
Lime = Strong uptrend
Green = Uptrend
Blue = Neutral uptrend
Red = Declining uptrend
Black = Bearish decline
Grey = Cautious recovery from Bearish decline
Blank Area = no signal
Should be used with two more indicators for confirmation.
Enjoy!
保護スクリプト
このスクリプトのソースコードは非公開で投稿されています。 ただし、制限なく自由に使用できます – 詳細はこちらでご確認ください。
免責事項
この情報および投稿は、TradingViewが提供または推奨する金融、投資、トレード、その他のアドバイスや推奨を意図するものではなく、それらを構成するものでもありません。詳細は利用規約をご覧ください。
保護スクリプト
このスクリプトのソースコードは非公開で投稿されています。 ただし、制限なく自由に使用できます – 詳細はこちらでご確認ください。
免責事項
この情報および投稿は、TradingViewが提供または推奨する金融、投資、トレード、その他のアドバイスや推奨を意図するものではなく、それらを構成するものでもありません。詳細は利用規約をご覧ください。