OPEN-SOURCE SCRIPT
更新済 NYSE UVOL Ratio

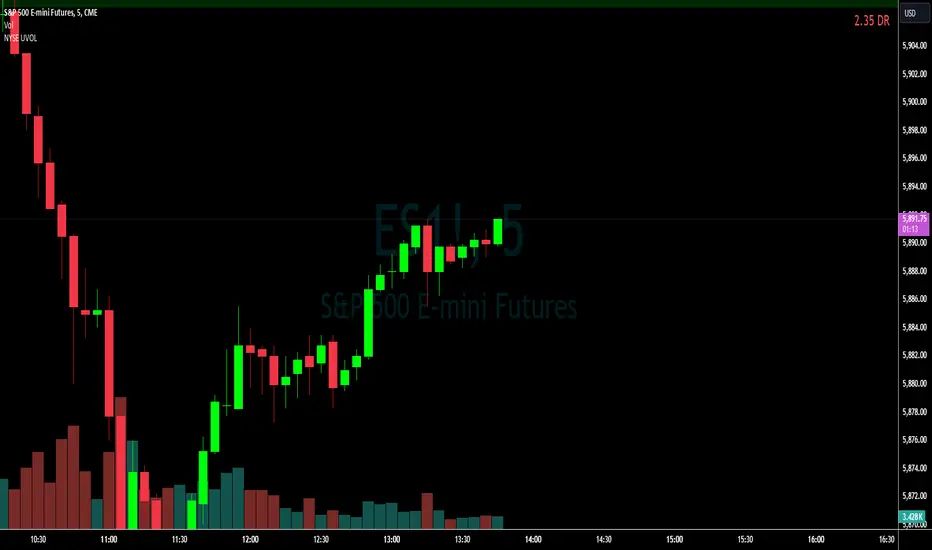
This Pine Script is designed to monitor and display the ratio of advancing volume (UVOL) to declining volume (DVOL) on the NYSE in real-time on your TradingView charts. Here's a breakdown of what each part of the script does:
Indicator Declaration: The script starts by declaring an indicator called "NYSE UVOL" with the option to overlay it directly on the price chart. This allows you to see the volume ratio in context with price movements.
Volume Data Fetching:
Advancing Volume (UVOL): It retrieves the closing value of the advancing volume from the NYSE.
Declining Volume (DVOL): It fetches the closing value of the declining volume.
Ratio Calculation:
The script calculates the ratio of advancing to declining volume. To avoid division by zero, it checks if the declining volume is not zero before performing the division.
Color Coding:
The script assigns a color to the ratio value based on set thresholds:
Red for a ratio less than 1 (more declining than advancing volume).
White for ratios between 1 and 2.
Lime for ratios between 2 and 3.
Green for ratios above 3.
Display Table:
A table is created in the top-right corner of the chart to display the current ratio value.
It updates this table with the latest ratio value at each new bar, displaying the ratio with appropriate color coding for quick reference.
This script provides a visual and numerical representation of market sentiment based on volume data, aiding traders in assessing the balance between buying and selling pressure.
リリースノート
Modified to avoid fractions when DVOL greater than UVOL.New values are displayed in red when DVOL exceeds UVOL and green when UVOL exceeds DVOL.
オープンソーススクリプト
TradingViewの精神に則り、このスクリプトの作者はコードをオープンソースとして公開してくれました。トレーダーが内容を確認・検証できるようにという配慮です。作者に拍手を送りましょう!無料で利用できますが、コードの再公開はハウスルールに従う必要があります。
免責事項
この情報および投稿は、TradingViewが提供または推奨する金融、投資、トレード、その他のアドバイスや推奨を意図するものではなく、それらを構成するものでもありません。詳細は利用規約をご覧ください。
オープンソーススクリプト
TradingViewの精神に則り、このスクリプトの作者はコードをオープンソースとして公開してくれました。トレーダーが内容を確認・検証できるようにという配慮です。作者に拍手を送りましょう!無料で利用できますが、コードの再公開はハウスルールに従う必要があります。
免責事項
この情報および投稿は、TradingViewが提供または推奨する金融、投資、トレード、その他のアドバイスや推奨を意図するものではなく、それらを構成するものでもありません。詳細は利用規約をご覧ください。