OPEN-SOURCE SCRIPT
更新済 SMC Timing
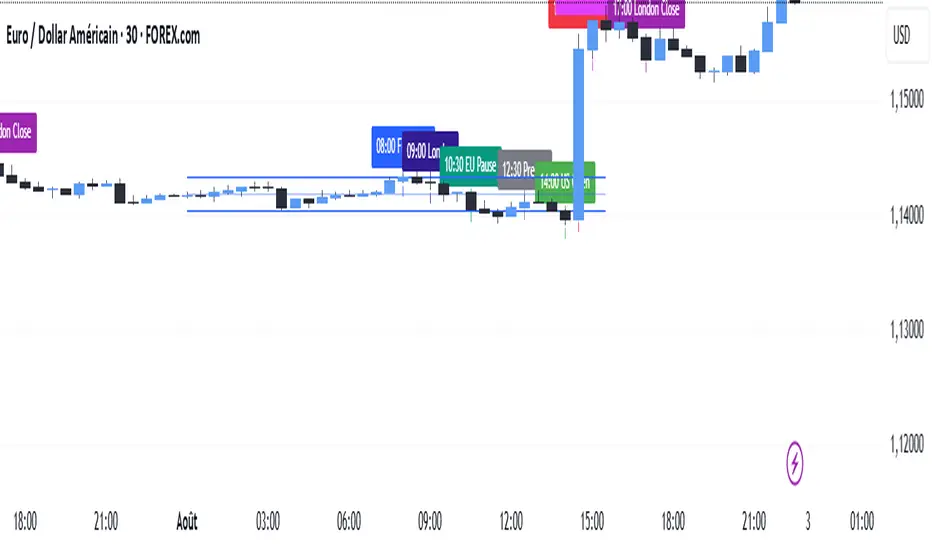
This indicator (“SMC Timing”) visually marks the exact moments when the market typically experiences large liquidity injections—moments that often trigger strong directional moves. By plotting dashed vertical lines and labels at key session boundaries and news events (Frankfurt open, London open, EU mid-session pause, Pre-US, US open, 14:30 U.S. news releases, 15:00 breakout window, and the London close), it draws your attention to the times when stop-runs and institutional orders tend to pile into the market.
Traders can use these timing zones to:
Anticipate liquidity sweeps where smart-money often liquidates weak positions or hunts stops.
Plan higher-probability entries just before or directly after these injections, reducing slippage and improving execution.
Improve win-rate consistency by aligning your trades with the natural ebb and flow of institutional flow rather than fading it.
With customizable session toggles, a “today-only” filter, and a small vertical offset to keep markers clear of price bars, this tool seamlessly integrates into any chart. Positioning yourself around these highlighted times helps you capture the bulk of intraday moves and avoids getting caught in low-liquidity chop.
リリースノート
This indicator (“SMC Timing”) visually marks the exact moments when the market typically experiences large liquidity injections—moments that often trigger strong directional moves. By plotting dashed vertical lines and labels at key session boundaries and news events (Frankfurt open, London open, EU mid-session pause, Pre-US, US open, 14:30 U.S. news releases, 15:00 breakout window, and the London close), it draws your attention to the times when stop-runs and institutional orders tend to pile into the market.Traders can use these timing zones to:
Anticipate liquidity sweeps where smart-money often liquidates weak positions or hunts stops.
Plan higher-probability entries just before or directly after these injections, reducing slippage and improving execution.
Improve win-rate consistency by aligning your trades with the natural ebb and flow of institutional flow rather than fading it.
With customizable session toggles, a “today-only” filter, and a small vertical offset to keep markers clear of price bars, this tool seamlessly integrates into any chart. Positioning yourself around these highlighted times helps you capture the bulk of intraday moves and avoids getting caught in low-liquidity chop.
リリースノート
V6リリースノート
This indicator (“SMC Timing”) visually marks the exact moments when the market typically experiences large liquidity injections—moments that often trigger strong directional moves. By plotting dashed vertical lines and labels at key session boundaries and news events (Frankfurt open, London open, EU mid-session pause, Pre-US, US open, 14:30 U.S. news releases, 15:00 breakout window, and the London close), it draws your attention to the times when stop-runs and institutional orders tend to pile into the market.Traders can use these timing zones to:
Anticipate liquidity sweeps where smart-money often liquidates weak positions or hunts stops.
Plan higher-probability entries just before or directly after these injections, reducing slippage and improving execution.
Improve win-rate consistency by aligning your trades with the natural ebb and flow of institutional flow rather than fading it.
With customizable session toggles, a “today-only” filter, and a small vertical offset to keep markers clear of price bars, this tool seamlessly integrates into any chart. Positioning yourself around these highlighted times helps you capture the bulk of intraday moves and avoids getting caught in low-liquidity chop.
hier
Notes de version
This indicator (“SMC Timing”) visually marks the exact moments when the market typically experiences large liquidity injections—moments that often trigger strong directional moves. By plotting dashed vertical lines and labels at key session boundaries and news events (Frankfurt open, London open, EU mid-session pause, Pre-US, US open, 14:30 U.S. news releases, 15:00 breakout window, and the London close), it draws your attention to the times when stop-runs and institutional orders tend to pile into the market.
Traders can use these timing zones to:
Anticipate liquidity sweeps where smart-money often liquidates weak positions or hunts stops.
Plan higher-probability entries just before or directly after these injections, reducing slippage and improving execution.
Improve win-rate consistency by aligning your trades with the natural ebb and flow of institutional flow rather than fading it.
With customizable session toggles, a “today-only” filter, and a small vertical offset to keep markers clear of price bars, this tool seamlessly integrates into any chart. Positioning yourself around these highlighted times helps you capture the bulk of intraday moves and avoids getting caught in low-liquidity chop.
オープンソーススクリプト
TradingViewの精神に則り、このスクリプトの作者はコードをオープンソースとして公開してくれました。トレーダーが内容を確認・検証できるようにという配慮です。作者に拍手を送りましょう!無料で利用できますが、コードの再公開はハウスルールに従う必要があります。
免責事項
この情報および投稿は、TradingViewが提供または推奨する金融、投資、トレード、その他のアドバイスや推奨を意図するものではなく、それらを構成するものでもありません。詳細は利用規約をご覧ください。
オープンソーススクリプト
TradingViewの精神に則り、このスクリプトの作者はコードをオープンソースとして公開してくれました。トレーダーが内容を確認・検証できるようにという配慮です。作者に拍手を送りましょう!無料で利用できますが、コードの再公開はハウスルールに従う必要があります。
免責事項
この情報および投稿は、TradingViewが提供または推奨する金融、投資、トレード、その他のアドバイスや推奨を意図するものではなく、それらを構成するものでもありません。詳細は利用規約をご覧ください。