OPEN-SOURCE SCRIPT
Intraday Perpetual Premium & Z-Score
This indicator measures the real-time premium of a perpetual futures contract relative to its spot market and interprets it through a statistical lens.
It helps traders detect when funding pressure is building, when leverage is being unwound, and when crowding in the futures market may precede volatility.
How it works
• Premium (%) = (Perp – Spot) ÷ Spot × 100
The script fetches both spot and perpetual prices and calculates their percentage difference each minute.
• Rolling Mean & Z-Score
Over a 4-hour look-back, it computes the average premium and standard deviation to derive a Z-Score, showing how stretched current sentiment is.
• Dynamic ±2σ Bands highlight statistically extreme premiums or discounts.
• Rate of Change (ROC) over one hour gauges the short-term directional acceleration of funding flows.
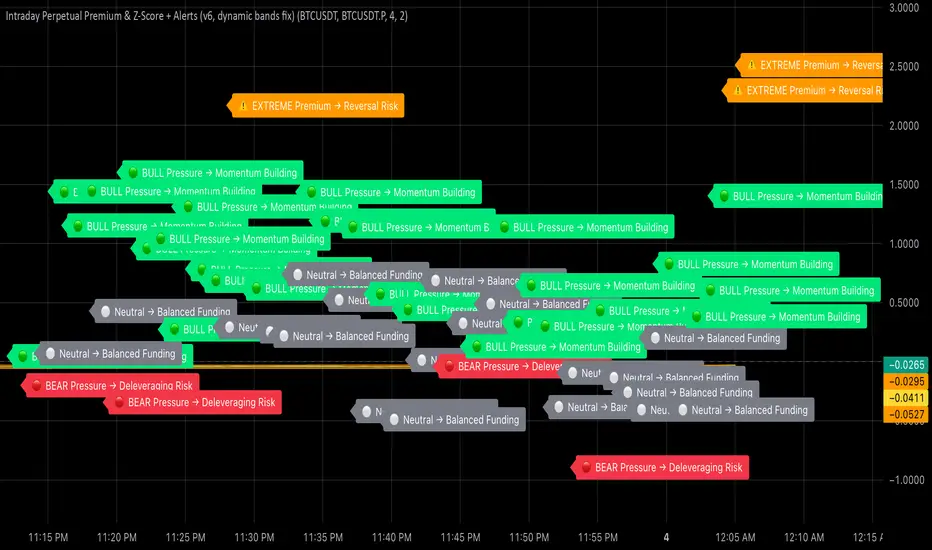
Colour & Label Interpretation
Visual cue Meaning Trading Implication
🟢 Green bars + “BULL Pressure” Premium rising faster than mean Leverage inflows → momentum strengthening
🔴 Red bars + “BEAR Pressure” Premium shrinking Leverage unwind → pull-back or consolidation
⚠️ Orange “EXTREME Premium/Discount” Crowded trade → heightened reversal risk
⚪ Grey bars Neutral Balanced conditions
Alerts
• Bull Pressure Alert → funding & premium rising (momentum building)
• Bear Pressure Alert → premium falling (deleveraging)
• Extreme Premium Alert → crowded longs; potential top
• Extreme Discount Alert → capitulation; possible bottom
Use case
Combine this indicator with your Heikin-Ashi, RSI, and MACD confluence rules:
• Enter only when your oscillators are low → curling up and Bull Pressure triggers.
• Trim or exit when Bear Pressure or Extreme Premium appears.
• Watch for Extreme Discount during flushes as an early bottoming clue.
It helps traders detect when funding pressure is building, when leverage is being unwound, and when crowding in the futures market may precede volatility.
How it works
• Premium (%) = (Perp – Spot) ÷ Spot × 100
The script fetches both spot and perpetual prices and calculates their percentage difference each minute.
• Rolling Mean & Z-Score
Over a 4-hour look-back, it computes the average premium and standard deviation to derive a Z-Score, showing how stretched current sentiment is.
• Dynamic ±2σ Bands highlight statistically extreme premiums or discounts.
• Rate of Change (ROC) over one hour gauges the short-term directional acceleration of funding flows.
Colour & Label Interpretation
Visual cue Meaning Trading Implication
🟢 Green bars + “BULL Pressure” Premium rising faster than mean Leverage inflows → momentum strengthening
🔴 Red bars + “BEAR Pressure” Premium shrinking Leverage unwind → pull-back or consolidation
⚠️ Orange “EXTREME Premium/Discount” Crowded trade → heightened reversal risk
⚪ Grey bars Neutral Balanced conditions
Alerts
• Bull Pressure Alert → funding & premium rising (momentum building)
• Bear Pressure Alert → premium falling (deleveraging)
• Extreme Premium Alert → crowded longs; potential top
• Extreme Discount Alert → capitulation; possible bottom
Use case
Combine this indicator with your Heikin-Ashi, RSI, and MACD confluence rules:
• Enter only when your oscillators are low → curling up and Bull Pressure triggers.
• Trim or exit when Bear Pressure or Extreme Premium appears.
• Watch for Extreme Discount during flushes as an early bottoming clue.
オープンソーススクリプト
TradingViewの精神に則り、このスクリプトの作者はコードをオープンソースとして公開してくれました。トレーダーが内容を確認・検証できるようにという配慮です。作者に拍手を送りましょう!無料で利用できますが、コードの再公開はハウスルールに従う必要があります。
免責事項
この情報および投稿は、TradingViewが提供または推奨する金融、投資、トレード、その他のアドバイスや推奨を意図するものではなく、それらを構成するものでもありません。詳細は利用規約をご覧ください。
オープンソーススクリプト
TradingViewの精神に則り、このスクリプトの作者はコードをオープンソースとして公開してくれました。トレーダーが内容を確認・検証できるようにという配慮です。作者に拍手を送りましょう!無料で利用できますが、コードの再公開はハウスルールに従う必要があります。
免責事項
この情報および投稿は、TradingViewが提供または推奨する金融、投資、トレード、その他のアドバイスや推奨を意図するものではなく、それらを構成するものでもありません。詳細は利用規約をご覧ください。