OPEN-SOURCE SCRIPT
更新済 NSDT Indicator Panel

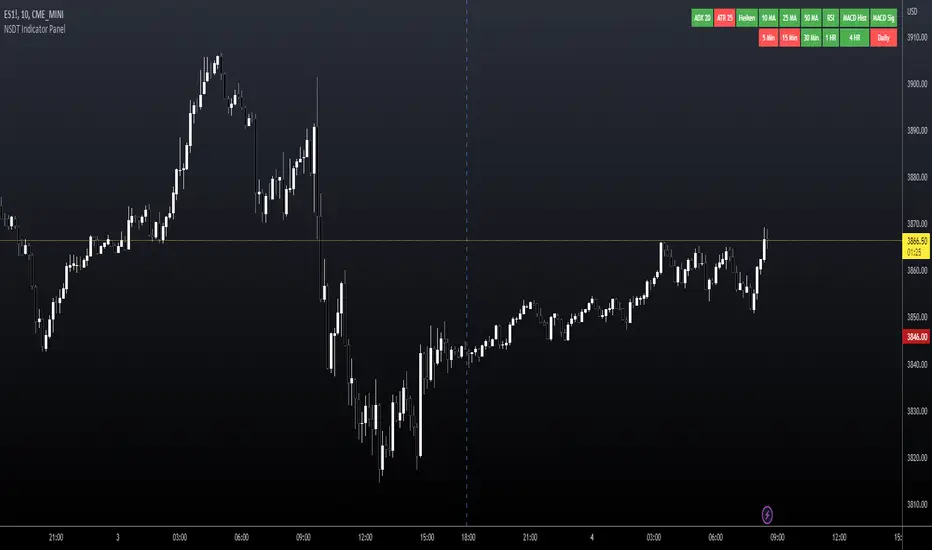
This indicator places a table on the bottom of the chart where each section changes color based on settings in each individual indicator. It provides a way to quickly glance at the chart and see the overall direction of the market with the combination of indicators.
All settings for each individual indicator are editable, so you can customize them to your unique specifications.
All settings for each individual indicator are editable, so you can customize them to your unique specifications.
リリースノート
Fixed error found by a user that when looking at a smaller timeframe, it wasn't correctly plotting the direction of higher timeframes. Bug fixed.リリースノート
Added the ability to adjust the size of the text in the panel.リリースノート
Added ATR per user request.リリースノート
Added 5min tracking to the Panel by request. Fixed logic for calculating higher timeframes with assistance from @exmodaus.リリースノート
By request from user @thrilledCamel77436 we have added the ability to choose the location of the Panel. Choices are Top Left, Top Right, Bottom Left, and Bottom Right. Thank you for the suggestion.リリースノート
A user mentioned they were getting a study error as there were too many variable being called. Modified code to fix.リリースノート
Added code to display each MA Length and the ADX Threshold in the Indicator Panel to make it easier to reference at a glance.リリースノート
Changed default location of panel. Changed default text size. Split panel into two rows and grouped similar indicators together for better viewing. Added the "Threshold" level to ATR. Fixed MACD to show green when "rising" and red when "falling", instead of just over/under the zero line.リリースノート
Added a Daily Timeframe to the second row per recommendation from Anthonyp652オープンソーススクリプト
TradingViewの精神に則り、このスクリプトの作者はコードをオープンソースとして公開してくれました。トレーダーが内容を確認・検証できるようにという配慮です。作者に拍手を送りましょう!無料で利用できますが、コードの再公開はハウスルールに従う必要があります。
ALL indicators, strategies and bots are included with Discord access.
NorthStarDayTrading.com/discord
youtube.com/shorts/fWFQE7uEHvU
NorthStarDayTrading.com/discord
youtube.com/shorts/fWFQE7uEHvU
免責事項
この情報および投稿は、TradingViewが提供または推奨する金融、投資、トレード、その他のアドバイスや推奨を意図するものではなく、それらを構成するものでもありません。詳細は利用規約をご覧ください。
オープンソーススクリプト
TradingViewの精神に則り、このスクリプトの作者はコードをオープンソースとして公開してくれました。トレーダーが内容を確認・検証できるようにという配慮です。作者に拍手を送りましょう!無料で利用できますが、コードの再公開はハウスルールに従う必要があります。
ALL indicators, strategies and bots are included with Discord access.
NorthStarDayTrading.com/discord
youtube.com/shorts/fWFQE7uEHvU
NorthStarDayTrading.com/discord
youtube.com/shorts/fWFQE7uEHvU
免責事項
この情報および投稿は、TradingViewが提供または推奨する金融、投資、トレード、その他のアドバイスや推奨を意図するものではなく、それらを構成するものでもありません。詳細は利用規約をご覧ください。