OPEN-SOURCE SCRIPT
CARNAC Elasticity Indicator
アップデート済
The CARNAC Elasticity Indicator (EI) is a technical analysis tool designed for traders and investors using TradingView. It calculates the percentage deviation of the current price from an Exponential Moving Average (EMA) and helps traders identify potential overbought and oversold conditions in a financial instrument.
Key Features:
EMA Length: Users can customize the length of the Exponential Moving Average (EMA) used in the calculations by adjusting the "EMA Length" parameter in the indicator settings.
Percentage Deviation: The indicator calculates the percentage deviation of the current price from the EMA. Positive values indicate prices above the EMA, while negative values indicate prices below the EMA.
Maximum Deviations: The indicator tracks the maximum positive (above EMA) and negative (below EMA) percentage deviations over time, allowing traders to monitor extreme price movements.
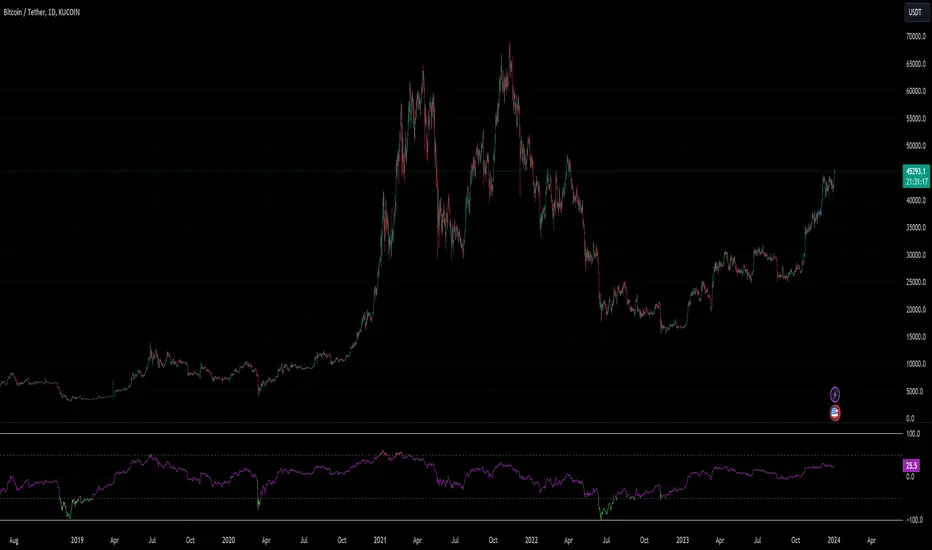
Bands: Upper and lower bands are displayed on the indicator chart at 100 and -100, respectively. Additionally, dashed middle bands at 50 and -50 provide reference points for moderate deviations.
Dynamic Color Coding: The indicator uses dynamic color coding to highlight the current percentage deviation. It turns red for values above 50 (indicating potential overbought conditions), green for values below -50 (indicating potential oversold conditions), and purple for values in between.
How to Use:
Overbought Conditions: Watch for the percentage deviation to cross above 50, indicating potential overbought conditions. This might be a signal to consider selling or taking profits.
Oversold Conditions: Look for the percentage deviation to cross below -50, signaling potential oversold conditions. This could be an opportunity to consider buying or entering a long position.
Historical Extremes: Keep an eye on the upper and lower bands (100 and -100) to identify historical extremes in percentage deviation.
The CARNAC Elasticity Indicator can be a valuable tool for traders seeking to identify potential trend reversals and assess the strength of price movements. However, it should be used in conjunction with other technical analysis tools and risk management strategies for comprehensive trading decisions.
Key Features:
EMA Length: Users can customize the length of the Exponential Moving Average (EMA) used in the calculations by adjusting the "EMA Length" parameter in the indicator settings.
Percentage Deviation: The indicator calculates the percentage deviation of the current price from the EMA. Positive values indicate prices above the EMA, while negative values indicate prices below the EMA.
Maximum Deviations: The indicator tracks the maximum positive (above EMA) and negative (below EMA) percentage deviations over time, allowing traders to monitor extreme price movements.
Bands: Upper and lower bands are displayed on the indicator chart at 100 and -100, respectively. Additionally, dashed middle bands at 50 and -50 provide reference points for moderate deviations.
Dynamic Color Coding: The indicator uses dynamic color coding to highlight the current percentage deviation. It turns red for values above 50 (indicating potential overbought conditions), green for values below -50 (indicating potential oversold conditions), and purple for values in between.
How to Use:
Overbought Conditions: Watch for the percentage deviation to cross above 50, indicating potential overbought conditions. This might be a signal to consider selling or taking profits.
Oversold Conditions: Look for the percentage deviation to cross below -50, signaling potential oversold conditions. This could be an opportunity to consider buying or entering a long position.
Historical Extremes: Keep an eye on the upper and lower bands (100 and -100) to identify historical extremes in percentage deviation.
The CARNAC Elasticity Indicator can be a valuable tool for traders seeking to identify potential trend reversals and assess the strength of price movements. However, it should be used in conjunction with other technical analysis tools and risk management strategies for comprehensive trading decisions.
リリースノート
Added optional lines that track the deviation values for candle highs and lows. Can be toggled on or off in settings.リリースノート
Update the script to make sure the script loads in a panel below the primary chart instead of overlaying.オープンソーススクリプト
TradingViewの精神に則り、このスクリプトの作者は、トレーダーが理解し検証できるようにオープンソースで公開しています。作者に敬意を表します!無料で使用することができますが、このコードを投稿で再利用するには、ハウスルールに準拠する必要があります。 お気に入りに登録してチャート上でご利用頂けます。
免責事項
これらの情報および投稿は、TradingViewが提供または保証する金融、投資、取引、またはその他の種類のアドバイスや推奨を意図したものではなく、またそのようなものでもありません。詳しくは利用規約をご覧ください。