PROTECTED SOURCE SCRIPT
bakkta`s stochastic
Hey. This is bakkta.
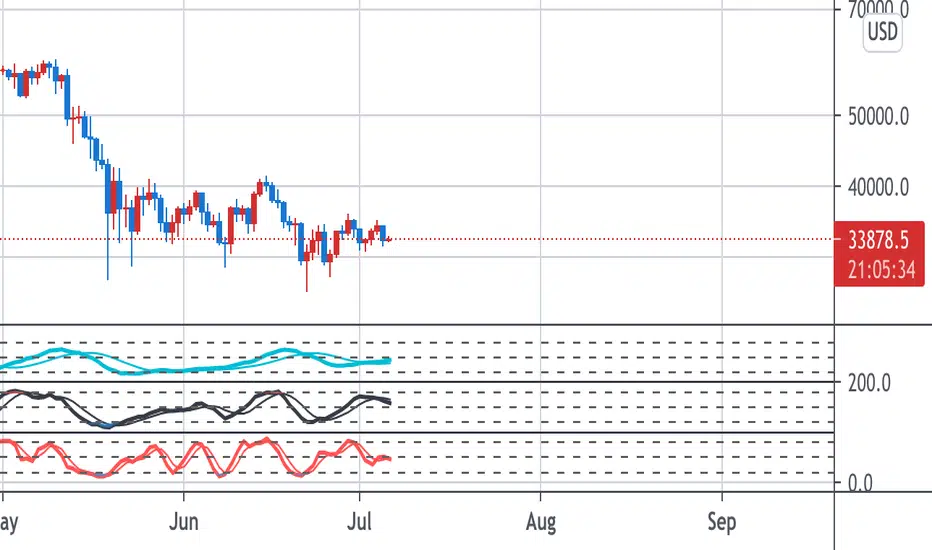
These are three stochastics when I trade. These stochastics` settings are subdivided. So we can predict the next movement if we use the time frame appropriately.
I call them “Big Wave”, “Middle Wave”, “Small Wave” from upper stochastic in order. Each stochastics` color is light blue(B.W.), black(M.W.) and red(S.W.). These colors are the same as the thing of 10M.A., 5M.A. and candle. In other words, When we find the divergences of stochastic, we have to compare B.W. with 10M.A., M.W. with 5M.A. and S.W. with candles.
Big Wave divergence is the most powerful wave and Small Wave divergence is the most weak wave. If we can see the Big wave divergence , It will be possible for the candle to reach a maximum 120M.A.
If the Middle Wave is observed in chart, candle will hit a maximum 60-day moving average. And If the Small Wave is shown us, candle will reach a maximum 20-day moving average. Besides there are a lot of conditions. But It's so complicated and long. So I`ll just shorten the explanation.
This indicator can apply to any market for example stocks, futures, forex, Cfds etc. You don't need to control the setting of this indicator. You can just use because there is only one principle to apply to this.
If you want more information , check my profile. Tha!
保護スクリプト
このスクリプトのソースコードは非公開で投稿されています。 ただし、制限なく自由に使用できます – 詳細はこちらでご確認ください。
NO.1 Trading Coach in south korea
免責事項
この情報および投稿は、TradingViewが提供または推奨する金融、投資、トレード、その他のアドバイスや推奨を意図するものではなく、それらを構成するものでもありません。詳細は利用規約をご覧ください。
保護スクリプト
このスクリプトのソースコードは非公開で投稿されています。 ただし、制限なく自由に使用できます – 詳細はこちらでご確認ください。
NO.1 Trading Coach in south korea
免責事項
この情報および投稿は、TradingViewが提供または推奨する金融、投資、トレード、その他のアドバイスや推奨を意図するものではなく、それらを構成するものでもありません。詳細は利用規約をご覧ください。