OPEN-SOURCE SCRIPT
更新済 Connors RSI (ValueRay)
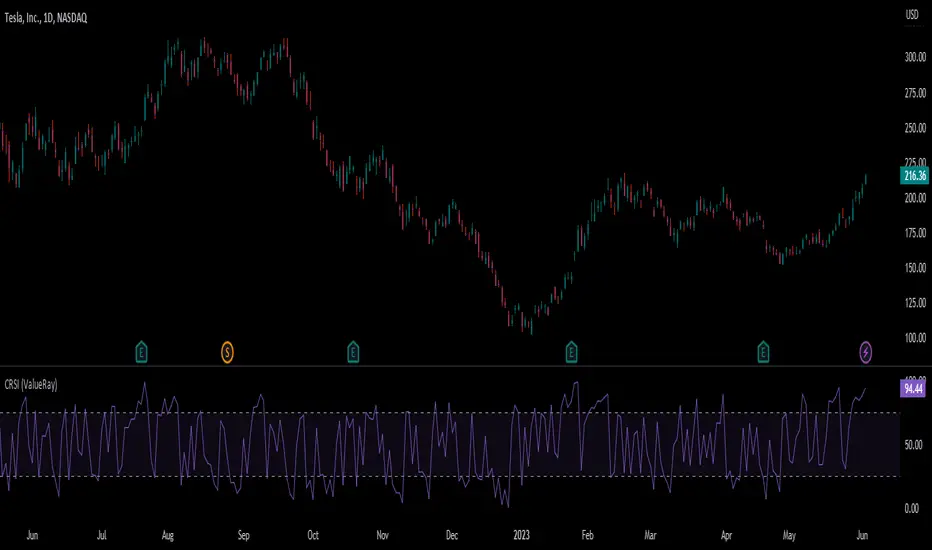
In compare to Tradingview Connors RSI, in this one you can choose which of the parts of the CRSI you want see:
The Connors RSI is a technical indicator developed by Larry Connors. It combines three different elements - price momentum, relative strength, and mean reversion - to identify potential buy and sell signals. The indicator measures the level of overbought or oversold conditions in a security, aiming to generate signals for short-term trading opportunities. It is widely used by traders to assess the strength and direction of price movements and to identify potential entry and exit points in the market.
- RSI
- Connors RSI
- Up/Down RSI
- Percent Rank
The Connors RSI is a technical indicator developed by Larry Connors. It combines three different elements - price momentum, relative strength, and mean reversion - to identify potential buy and sell signals. The indicator measures the level of overbought or oversold conditions in a security, aiming to generate signals for short-term trading opportunities. It is widely used by traders to assess the strength and direction of price movements and to identify potential entry and exit points in the market.
リリースノート
- removed link (house rules policy)
オープンソーススクリプト
TradingViewの精神に則り、このスクリプトの作者はコードをオープンソースとして公開してくれました。トレーダーが内容を確認・検証できるようにという配慮です。作者に拍手を送りましょう!無料で利用できますが、コードの再公開はハウスルールに従う必要があります。
ValueRay ➤ AI driven Stock Screener and Value Analyser
免責事項
この情報および投稿は、TradingViewが提供または推奨する金融、投資、トレード、その他のアドバイスや推奨を意図するものではなく、それらを構成するものでもありません。詳細は利用規約をご覧ください。