OPEN-SOURCE SCRIPT
更新済 Hybrid Trend MA
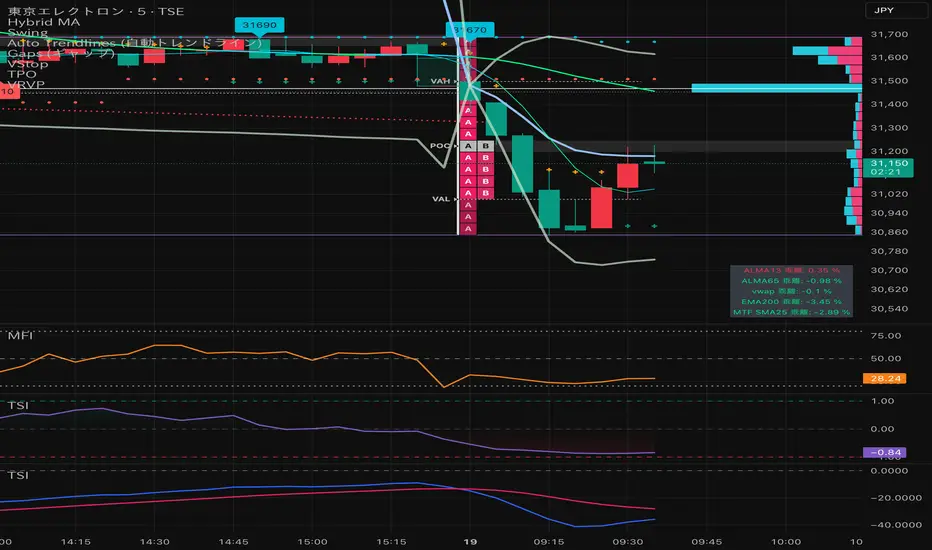
Hybrid Trend MA (Pine Script v6)
This indicator combines Exponential Moving Averages (EMA) and Arnaud Legoux Moving Averages (ALMA) into a single hybrid trend-following tool. It is designed to help traders visualize medium- and long-term trend directions while also capturing smoother short-term signals.
Key Features:
EMA Trend Structure
Three EMAs are plotted (lengths: 38, 62, 200).
Each EMA line changes color depending on whether it is rising or falling relative to the others:
Red → Strong uptrend alignment.
Lime → Strong downtrend alignment.
Aqua → Neutral or transition.
The indicator also fills the space between EMA zones with silver shading to highlight trend channels.
ALMA Trend Confirmation
Two ALMA curves are plotted (lengths: 13, 50).
Similar rising/falling logic is applied to color them:
Red → Bullish alignment and rising.
Green → Bearish alignment and falling.
Cyan → Neutral or uncertain trend.
A cross marker is plotted whenever the fast and slow ALMA lines cross, which may serve as an entry/exit confirmation.
Customizable Smoothing
The smoothe setting controls how many bars are checked to confirm whether an EMA or ALMA is rising/falling, helping reduce noise.
How to Use:
Trend Identification: The EMA set shows the larger market structure. When all EMAs align in direction and color, the trend is stronger.
Entry & Exit Confirmation: The ALMA cross signals can be used to refine entries and exits within the broader EMA trend.
Dynamic Visuals: Colored EMAs + ALMAs make it easy to distinguish bullish, bearish, and ranging conditions at a glance.
リリースノート
Add VWAPオープンソーススクリプト
TradingViewの精神に則り、このスクリプトの作者はコードをオープンソースとして公開してくれました。トレーダーが内容を確認・検証できるようにという配慮です。作者に拍手を送りましょう!無料で利用できますが、コードの再公開はハウスルールに従う必要があります。
免責事項
この情報および投稿は、TradingViewが提供または推奨する金融、投資、トレード、その他のアドバイスや推奨を意図するものではなく、それらを構成するものでもありません。詳細は利用規約をご覧ください。
オープンソーススクリプト
TradingViewの精神に則り、このスクリプトの作者はコードをオープンソースとして公開してくれました。トレーダーが内容を確認・検証できるようにという配慮です。作者に拍手を送りましょう!無料で利用できますが、コードの再公開はハウスルールに従う必要があります。
免責事項
この情報および投稿は、TradingViewが提供または推奨する金融、投資、トレード、その他のアドバイスや推奨を意図するものではなく、それらを構成するものでもありません。詳細は利用規約をご覧ください。