OPEN-SOURCE SCRIPT
更新済 Bogdan Ciocoiu - Looking Glass
► Description
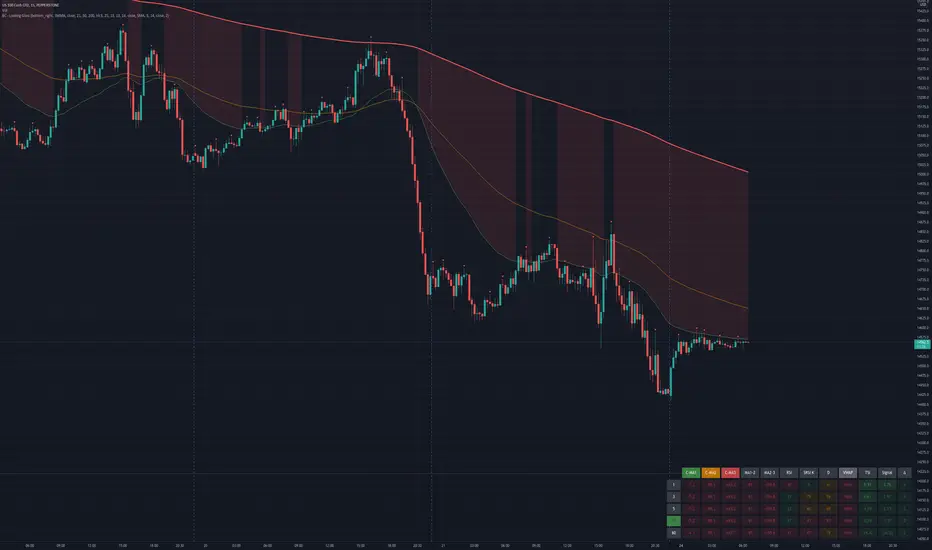
The script shows a multi-timeline suite of information for the current ticker. This information refers to configurable moving averages, RSI, Stochastic RSI, VWAP and TSI data. The timeframes reflected in the script vary from 1m to 1h. I recommend the tool for 3m scalping as it provides good visibility upwards.
The headings from the table are:
► Originality and usefulness
This tool is helpful because it helps users read a chart much quicker than if they were to navigate between timeframes. The colour coding indicates an accident/descendant trend between any two values (i.e. close vs MA1, MA1-MA2, RSI K vs RSI D, etc.).
► Open-source reuse
tradingview.com/support/solutions/43000502589-moving-average/
tradingview.com/support/solutions/43000502338-relative-strength-index-rsi/
tradingview.com/support/solutions/43000502333-stochastic-rsi-stoch-rsi/
tradingview.com/support/solutions/43000502018-volume-weighted-average-price-vwap/
tradingview.com/support/solutions/43000592290-true-strength-indicator/
The script shows a multi-timeline suite of information for the current ticker. This information refers to configurable moving averages, RSI, Stochastic RSI, VWAP and TSI data. The timeframes reflected in the script vary from 1m to 1h. I recommend the tool for 3m scalping as it provides good visibility upwards.
The headings from the table are:
- {Close} - {MA1}
- {Close} - {MA2}
- {Close} - {MA3}
- {MA1} - {MA2}
- {MA2} - {MA3}
- {RSI}
- {Stoch RSI K}
- {Stoch RSI D}
- {VWAP}
- {TSI}
- {TSI EMA}
- {TSI} - {TSI EMA}
► Originality and usefulness
This tool is helpful because it helps users read a chart much quicker than if they were to navigate between timeframes. The colour coding indicates an accident/descendant trend between any two values (i.e. close vs MA1, MA1-MA2, RSI K vs RSI D, etc.).
► Open-source reuse
tradingview.com/support/solutions/43000502589-moving-average/
tradingview.com/support/solutions/43000502338-relative-strength-index-rsi/
tradingview.com/support/solutions/43000502333-stochastic-rsi-stoch-rsi/
tradingview.com/support/solutions/43000502018-volume-weighted-average-price-vwap/
tradingview.com/support/solutions/43000592290-true-strength-indicator/
リリースノート
This tool now offers additional features such as managing which columns are being shown, making it more suitable for tablets and devices with limited screen estate.リリースノート
// Original Description// The script shows a multi-timeline suite of information for the current ticker. This information refers to configurable moving averages, RSI, Stochastic RSI, VWAP and TSI data. The timeframes reflected in the script vary from 1m to 1h. I recommend the tool for 3m scalping as it provides good visibility upwards.
// This is the updated version of the original script. Special thanks to SamAccountX for the support.
// Major updates compared to the v1 version include:
// - Being able to change the style of the lines, including width and colour
// - Being able to show/hide the table or specific columns/rows from within
// - Improvements in terms of naming the plots and shapes to ease traceability and managing settings
// - Optimised the previous revision by reducing the number of "request.security" calls, improving load and allowing room for more feature functionalities.
// - Allows repositioning the table subject to screen size and shape to suit the diverse type of terminals out there
オープンソーススクリプト
TradingViewの精神に則り、このスクリプトの作者はコードをオープンソースとして公開してくれました。トレーダーが内容を確認・検証できるようにという配慮です。作者に拍手を送りましょう!無料で利用できますが、コードの再公開はハウスルールに従う必要があります。
免責事項
この情報および投稿は、TradingViewが提供または推奨する金融、投資、トレード、その他のアドバイスや推奨を意図するものではなく、それらを構成するものでもありません。詳細は利用規約をご覧ください。
オープンソーススクリプト
TradingViewの精神に則り、このスクリプトの作者はコードをオープンソースとして公開してくれました。トレーダーが内容を確認・検証できるようにという配慮です。作者に拍手を送りましょう!無料で利用できますが、コードの再公開はハウスルールに従う必要があります。
免責事項
この情報および投稿は、TradingViewが提供または推奨する金融、投資、トレード、その他のアドバイスや推奨を意図するものではなく、それらを構成するものでもありません。詳細は利用規約をご覧ください。