OPEN-SOURCE SCRIPT
更新済 Multi Timeframe Moving Average Collection | Scalp [aamonkey]
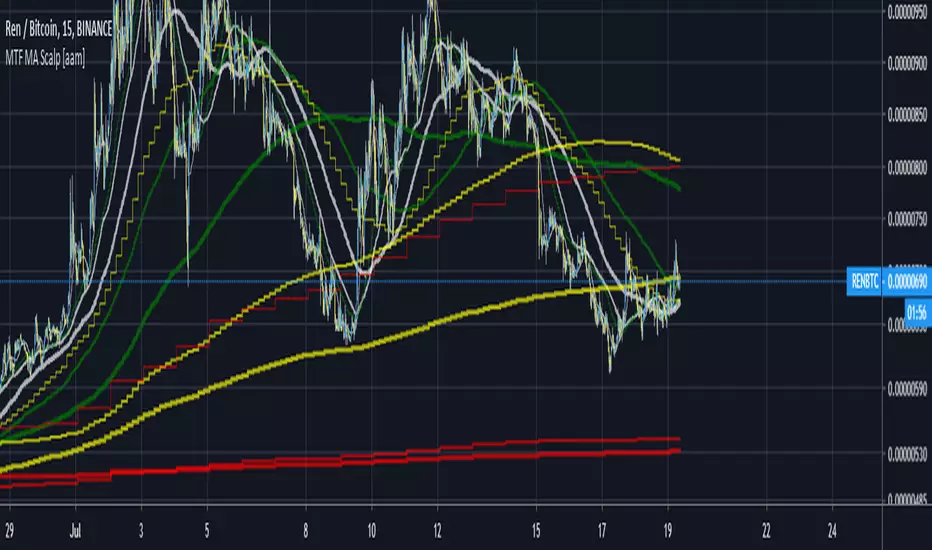
This is a Multi Timeframe Moving Average Collection (Scalp Edition).
Why use it?
- Spot cluster of MAs on one chart
- See support and resistance
- Spot "freefall zones"
In the default settings you will get:
20, 100 and 200 MA of the 15min, 1h, 4h, and the 1D chart.
The color indicates significance!
From weaker to stronger support/resistance:
white(15min), green(1h),yellow(4h),red(1D)
- Length of the MAs is modifiable
- Timeframes of the MAs is modifiable
- Which MAs you want to see
- Colors
リリースノート
200 MA on the 1D Fixリリースノート
Added Different linewidth for the different timeframes.リリースノート
Design changesオープンソーススクリプト
TradingViewの精神に則り、このスクリプトの作者はコードをオープンソースとして公開してくれました。トレーダーが内容を確認・検証できるようにという配慮です。作者に拍手を送りましょう!無料で利用できますが、コードの再公開はハウスルールに従う必要があります。
免責事項
この情報および投稿は、TradingViewが提供または推奨する金融、投資、トレード、その他のアドバイスや推奨を意図するものではなく、それらを構成するものでもありません。詳細は利用規約をご覧ください。
オープンソーススクリプト
TradingViewの精神に則り、このスクリプトの作者はコードをオープンソースとして公開してくれました。トレーダーが内容を確認・検証できるようにという配慮です。作者に拍手を送りましょう!無料で利用できますが、コードの再公開はハウスルールに従う必要があります。
免責事項
この情報および投稿は、TradingViewが提供または推奨する金融、投資、トレード、その他のアドバイスや推奨を意図するものではなく、それらを構成するものでもありません。詳細は利用規約をご覧ください。