OPEN-SOURCE SCRIPT
Initial Balance Breakout + Fib
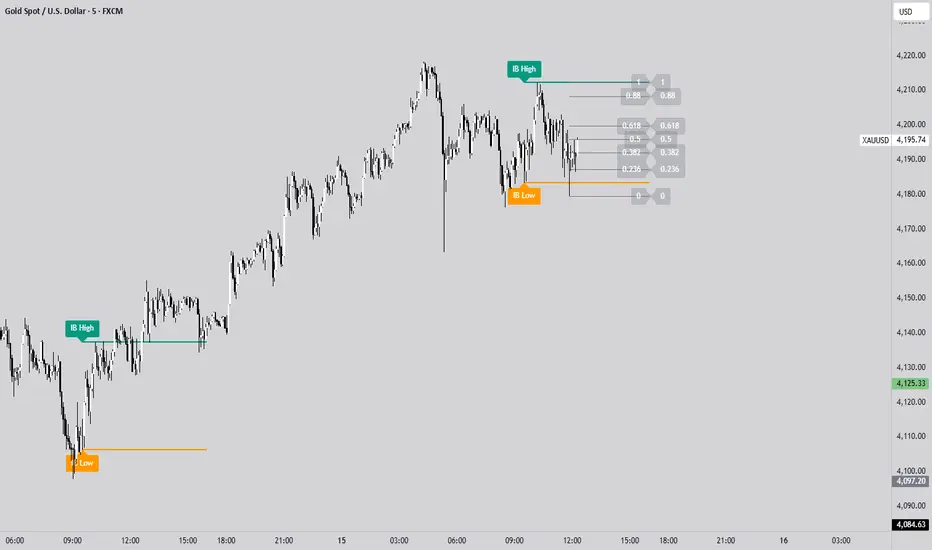
The IB High / Low + Auto-Fib indicator automatically plots the Initial Balance range and a Fibonacci projection for each trading day.
Define your IB start and end times (e.g., 09:30–10:30).
The indicator marks the IB High and IB Low from that session and extends them to the session close.
It keeps the last N days visible for context.
When price breaks outside the IB range, it automatically plots a Fibonacci retracement/extension from the opposite IB side to the breakout, using levels 0, 0.236, 0.382, 0.5, 0.618, 0.88, 1.
The Fib updates dynamically as the breakout extends, and labels are neatly aligned on the right side of the chart for clarity.
Ideal for traders who monitor Initial Balance breaks, range expansions, and Fibonacci reaction levels throughout the trading session.
オープンソーススクリプト
TradingViewの精神に則り、この作者はスクリプトのソースコードを公開しているので、その内容を理解し検証することができます。作者に感謝です!無料でお使いいただけますが、このコードを投稿に再利用する際にはハウスルールに従うものとします。
免責事項
これらの情報および投稿は、TradingViewが提供または保証する金融、投資、取引、またはその他の種類のアドバイスや推奨を意図したものではなく、またそのようなものでもありません。詳しくは利用規約をご覧ください。
オープンソーススクリプト
TradingViewの精神に則り、この作者はスクリプトのソースコードを公開しているので、その内容を理解し検証することができます。作者に感謝です!無料でお使いいただけますが、このコードを投稿に再利用する際にはハウスルールに従うものとします。
免責事項
これらの情報および投稿は、TradingViewが提供または保証する金融、投資、取引、またはその他の種類のアドバイスや推奨を意図したものではなく、またそのようなものでもありません。詳しくは利用規約をご覧ください。