OPEN-SOURCE SCRIPT
[naoligo] Didi's Needle - Agulhada do Didi
EN-US
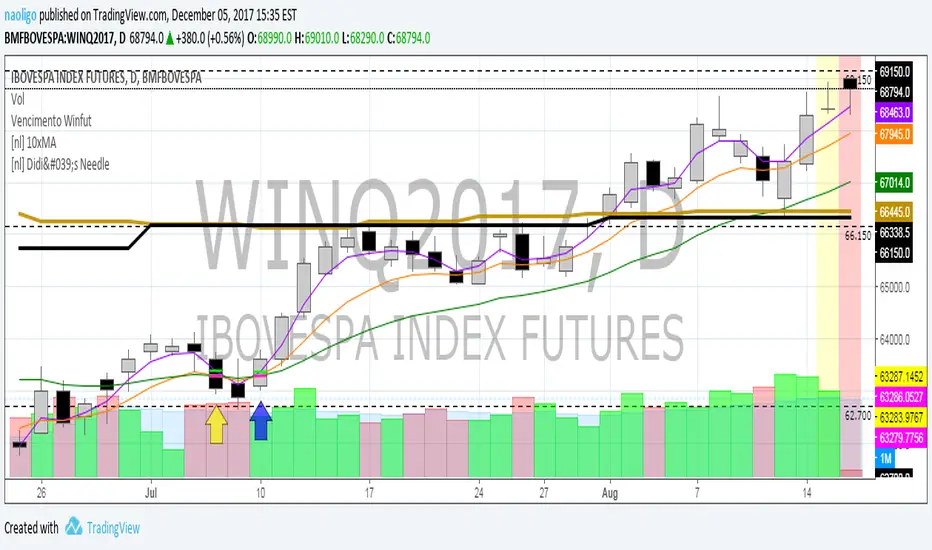
This indicator was created based on the famous 'Agulhada do Didi', created by the mythological Odir Aguiar. It has a very simple operation and can be applied in any graphical time, but the idea is that the longer the time, the better, following the classical Technical Analysis, that trends in larger graph times are stronger.
The candles are duly marked by arrows indicating the possible direction of the movement, being yellow when it is preparation and blue (bullish) or oranges (bearish). Moving averages are plotted only in such candles, to serve for analysis of their positions.
Comment if you have any questions, criticisms or suggestions.
Have fun!
=======================================================
PT-BR
Esse indicador foi criado com base na famosa 'Agulhada do Didi', criada pelo mitológico Odir Aguiar. Possui funcionamento bem simples e pode ser aplicado em qualquer tempo gráfico, mas a idéia é que quanto maior for o tempo, melhor, seguindo a Análise Técnica clássica, de que tendências em tempos gráficos maiores são mais fortes.
Os candles são devidamente marcados por setas indicando a possível direção do movimento, sendo amarelas quando for preparação e azuis ( bullish ) ou laranjas ( bearish ). As médias móveis são plotadas apenas em tais candles, pra servir para análise de suas posições.
Comentem caso tenham qualquer dúvida, crítica ou sugestão.
Divirtam-se!
オープンソーススクリプト
TradingViewの精神に則り、このスクリプトの作者はコードをオープンソースとして公開してくれました。トレーダーが内容を確認・検証できるようにという配慮です。作者に拍手を送りましょう!無料で利用できますが、コードの再公開はハウスルールに従う必要があります。
免責事項
この情報および投稿は、TradingViewが提供または推奨する金融、投資、トレード、その他のアドバイスや推奨を意図するものではなく、それらを構成するものでもありません。詳細は利用規約をご覧ください。
オープンソーススクリプト
TradingViewの精神に則り、このスクリプトの作者はコードをオープンソースとして公開してくれました。トレーダーが内容を確認・検証できるようにという配慮です。作者に拍手を送りましょう!無料で利用できますが、コードの再公開はハウスルールに従う必要があります。
免責事項
この情報および投稿は、TradingViewが提供または推奨する金融、投資、トレード、その他のアドバイスや推奨を意図するものではなく、それらを構成するものでもありません。詳細は利用規約をご覧ください。