OPEN-SOURCE SCRIPT
更新済 Bullish Kicker
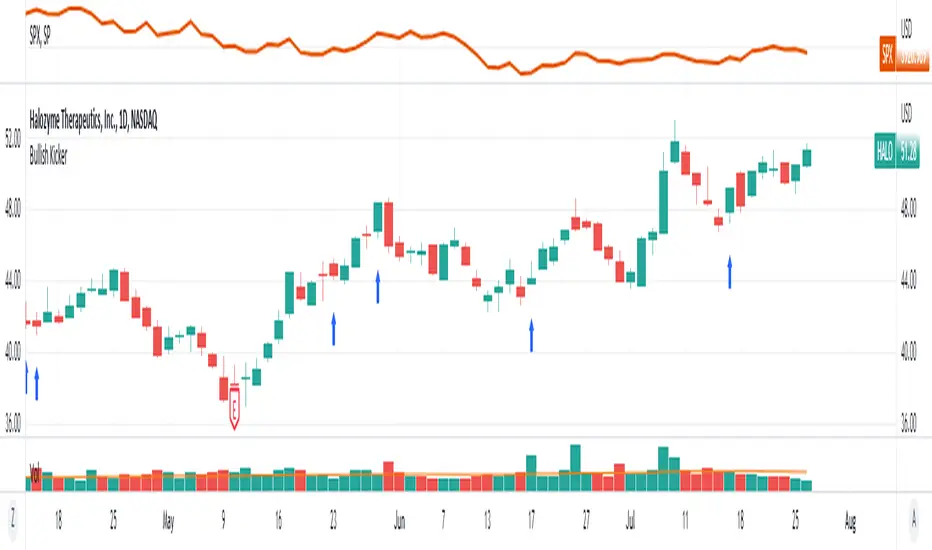
Identify bullish kicker candles on the chart. A bullish kicker candle occurs when the opening price is above the body of the previous candle. The previous candle must close lower than the open to qualify.
Indicator Settings
You can chose which shape and color to plot when a kicker candle occurs, as well as placement above, below or in a separate pane.
Bullish Kickers are indicated by blue arrows on the chart

Indicator Settings
You can chose which shape and color to plot when a kicker candle occurs, as well as placement above, below or in a separate pane.
Bullish Kickers are indicated by blue arrows on the chart
リリースノート
Update fixes the overlay to be on the chart first, rather than a pane belowリリースノート
Fixes plot location to be below bars by defaultリリースノート
Options to show only kickers where the opening price is the low of the day.リリースノート
code clean upリリースノート
Added the option to require a minimum gap amount to the kickerリリースノート
Fixed a bug found in previous versionオープンソーススクリプト
TradingViewの精神に則り、このスクリプトの作者はコードをオープンソースとして公開してくれました。トレーダーが内容を確認・検証できるようにという配慮です。作者に拍手を送りましょう!無料で利用できますが、コードの再公開はハウスルールに従う必要があります。
Trusted Pine programmer. Send me a message for script development.
免責事項
この情報および投稿は、TradingViewが提供または推奨する金融、投資、トレード、その他のアドバイスや推奨を意図するものではなく、それらを構成するものでもありません。詳細は利用規約をご覧ください。
オープンソーススクリプト
TradingViewの精神に則り、このスクリプトの作者はコードをオープンソースとして公開してくれました。トレーダーが内容を確認・検証できるようにという配慮です。作者に拍手を送りましょう!無料で利用できますが、コードの再公開はハウスルールに従う必要があります。
Trusted Pine programmer. Send me a message for script development.
免責事項
この情報および投稿は、TradingViewが提供または推奨する金融、投資、トレード、その他のアドバイスや推奨を意図するものではなく、それらを構成するものでもありません。詳細は利用規約をご覧ください。