OPEN-SOURCE SCRIPT
更新済 Shares Risk (Long)

Ever struggle to know how many shares you should be placing your order with? Risk is different for every person and every stock. This can help.
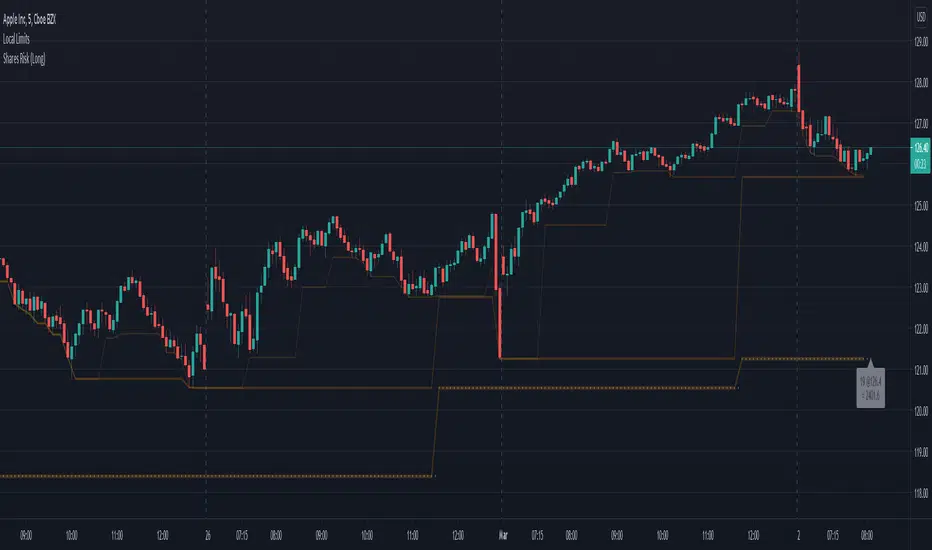
In the example above, I've added this indicator the the chart.
I then specified:
Based upon how much I'm willing to risk, and the price difference between the close and Risk Source, this indicator will show the number of shares to purchase such that if the price drops to the stop level specified, my value loss should be limited to the Risk Amount.
333 shares is the value calculated for this example (latest bar). You can easily see how many shares you need to purchase for the lastest bar as well as track the previous values on the chart and the indicator cursor data.
---
** WARNING: There's no magic here. It's just math. So if you specify another indicator as the source, the values could get a bit strange and if the price is very close to the stop level, the number of shares could be unreasonably high. To help avoid this you can increase the minimum percent.
In the example above, I've added this indicator the the chart.
I then specified:
- Risk Amount ($) = $500. (The max amount I'm willing to risk.)
- Risk Source = (another indicator) Lower Limit 3. (See Lower Limits for more details)
- Source Risk (%) = 0.0 (The default is 5.0 expecting the Risk Source to be the close.**)
Based upon how much I'm willing to risk, and the price difference between the close and Risk Source, this indicator will show the number of shares to purchase such that if the price drops to the stop level specified, my value loss should be limited to the Risk Amount.
333 shares is the value calculated for this example (latest bar). You can easily see how many shares you need to purchase for the lastest bar as well as track the previous values on the chart and the indicator cursor data.
---
** WARNING: There's no magic here. It's just math. So if you specify another indicator as the source, the values could get a bit strange and if the price is very close to the stop level, the number of shares could be unreasonably high. To help avoid this you can increase the minimum percent.
リリースノート
Updated position of chart to make label more visible.リリースノート
- Improved label.
- Used Local Limit 4 instead with corrected parameters.
リリースノート
Improved source value handling: Some sources are delayed because of their time frame and effectively report NaN until their next bar. This change persists their previously known value.オープンソーススクリプト
TradingViewの精神に則り、このスクリプトの作者はコードをオープンソースとして公開してくれました。トレーダーが内容を確認・検証できるようにという配慮です。作者に拍手を送りましょう!無料で利用できますが、コードの再公開はハウスルールに従う必要があります。
免責事項
この情報および投稿は、TradingViewが提供または推奨する金融、投資、トレード、その他のアドバイスや推奨を意図するものではなく、それらを構成するものでもありません。詳細は利用規約をご覧ください。
オープンソーススクリプト
TradingViewの精神に則り、このスクリプトの作者はコードをオープンソースとして公開してくれました。トレーダーが内容を確認・検証できるようにという配慮です。作者に拍手を送りましょう!無料で利用できますが、コードの再公開はハウスルールに従う必要があります。
免責事項
この情報および投稿は、TradingViewが提供または推奨する金融、投資、トレード、その他のアドバイスや推奨を意図するものではなく、それらを構成するものでもありません。詳細は利用規約をご覧ください。