OPEN-SOURCE SCRIPT
更新済 Multi Time Frame EMA Signal & Resistance
Full code and description: github.com/samgozman/MTF-EMA-Signal-and-Resistance
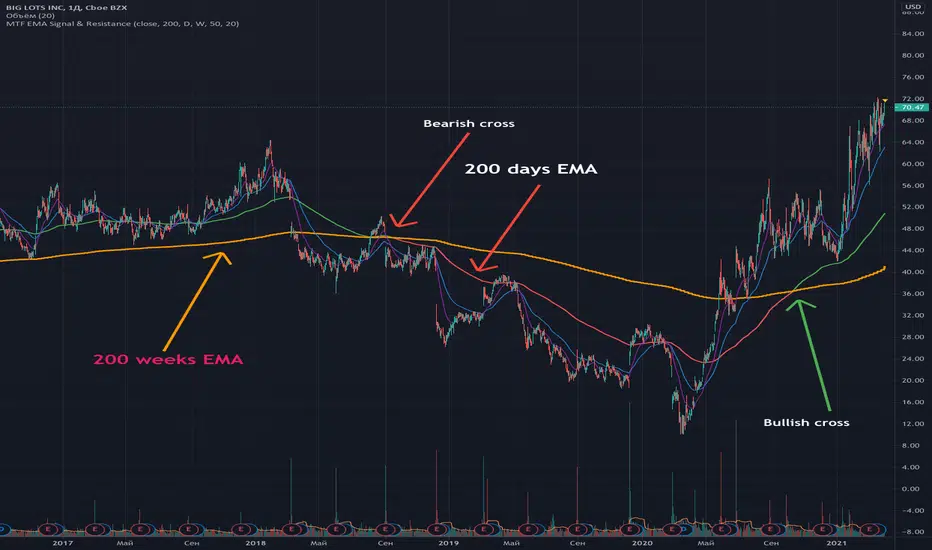
The idea of this script is quite simple. Imagine that you have a 200-day EMA and its support or resistance line is the 200-week EMA.
Then if EMA 200 1D > EMA 200 1W then the trend is bullish.
That is, EMA 200 1D is the signal line, and EMA 200 1W is the resistance.
Of course, you can independently set the time interval for the signal line and resistance, as well as the number of periods.
In addition to setting time intervals and period lengths, you can optionally enable the display of additional class EMAs.
You can also set the timeframe for the signal line equal to the current time period.
リリースノート
Chart updateオープンソーススクリプト
TradingViewの精神に則り、このスクリプトの作者はコードをオープンソースとして公開してくれました。トレーダーが内容を確認・検証できるようにという配慮です。作者に拍手を送りましょう!無料で利用できますが、コードの再公開はハウスルールに従う必要があります。
免責事項
この情報および投稿は、TradingViewが提供または推奨する金融、投資、トレード、その他のアドバイスや推奨を意図するものではなく、それらを構成するものでもありません。詳細は利用規約をご覧ください。
オープンソーススクリプト
TradingViewの精神に則り、このスクリプトの作者はコードをオープンソースとして公開してくれました。トレーダーが内容を確認・検証できるようにという配慮です。作者に拍手を送りましょう!無料で利用できますが、コードの再公開はハウスルールに従う必要があります。
免責事項
この情報および投稿は、TradingViewが提供または推奨する金融、投資、トレード、その他のアドバイスや推奨を意図するものではなく、それらを構成するものでもありません。詳細は利用規約をご覧ください。