OPEN-SOURCE SCRIPT
Donchian Channels + Avg Width % Dashboard
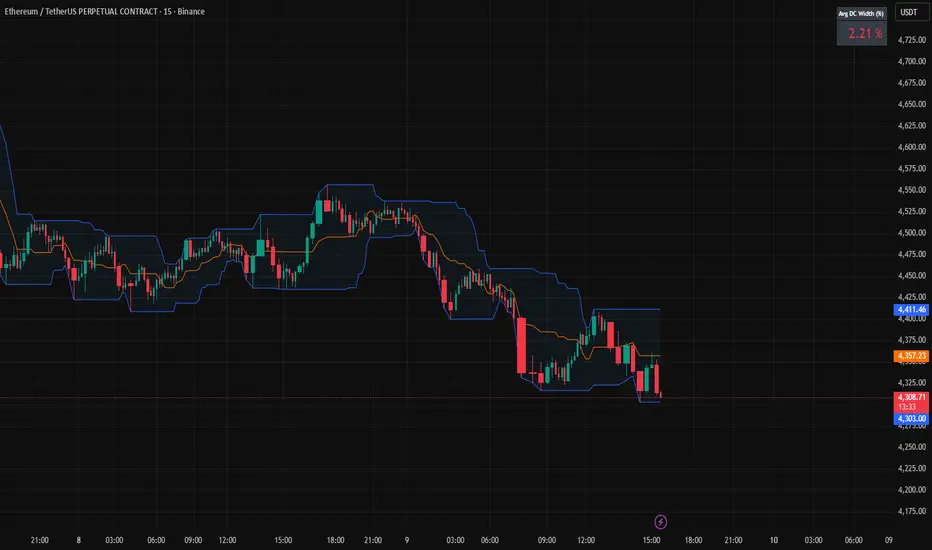
Measures the average percentage width between the Donchian Channel’s upper and lower bands over a chosen period.
It quantifies how much the market has been moving relative to price — a direct gauge of realized volatility.
When the average width is small, price is range-bound and unlikely to reach fixed TP targets; when it expands, volatility is sufficient for trend or breakout trades.
Based on how fast your strategy is, set your TP% below the average percentage of the Band Width.
オープンソーススクリプト
TradingViewの精神に則り、このスクリプトの作者はコードをオープンソースとして公開してくれました。トレーダーが内容を確認・検証できるようにという配慮です。作者に拍手を送りましょう!無料で利用できますが、コードの再公開はハウスルールに従う必要があります。
免責事項
この情報および投稿は、TradingViewが提供または推奨する金融、投資、トレード、その他のアドバイスや推奨を意図するものではなく、それらを構成するものでもありません。詳細は利用規約をご覧ください。
オープンソーススクリプト
TradingViewの精神に則り、このスクリプトの作者はコードをオープンソースとして公開してくれました。トレーダーが内容を確認・検証できるようにという配慮です。作者に拍手を送りましょう!無料で利用できますが、コードの再公開はハウスルールに従う必要があります。
免責事項
この情報および投稿は、TradingViewが提供または推奨する金融、投資、トレード、その他のアドバイスや推奨を意図するものではなく、それらを構成するものでもありません。詳細は利用規約をご覧ください。