PROTECTED SOURCE SCRIPT
Investment Bottom Indicator
Want to know when the market has reached near bottom in selloff or bearish trend?
You now have a perfect indicator for that - "Investment Bottom Indicator"
How to use?
Chart Setup-
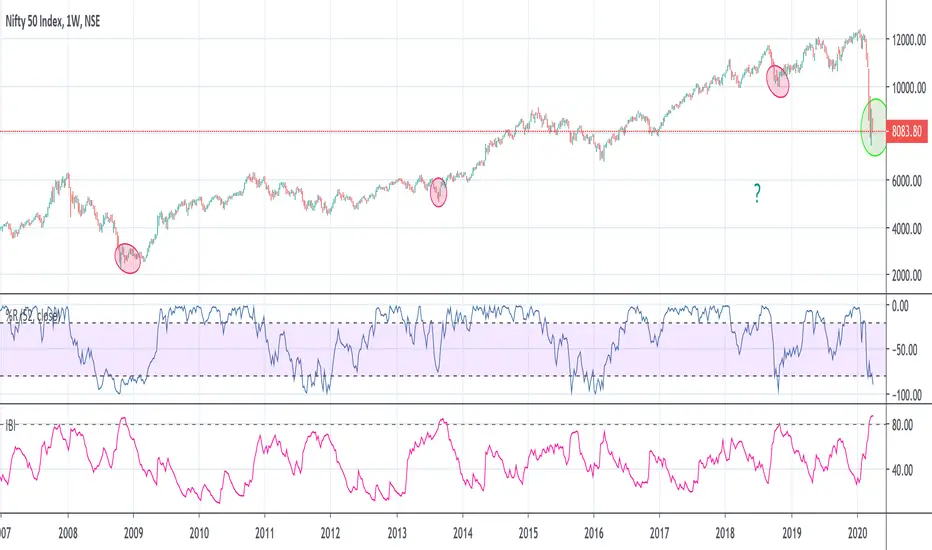
Step 1- Add your index symbol
Step 2- Change the time frame to weekly (candle sticks)
Step 3- Add William %R - settings: Period- 52, Close
Step 4- Add this indicator - Investment Bottom Indicator
Analysis-
When the William %R value is below -80 & Investment Bottom Indicator value is above 80 : this indicates that the market is near its bottom and if you have not yet started investing yet, this is the right time before the market flies off (in very few weeks/months) & you miss the bus!
You now have a perfect indicator for that - "Investment Bottom Indicator"
How to use?
Chart Setup-
Step 1- Add your index symbol
Step 2- Change the time frame to weekly (candle sticks)
Step 3- Add William %R - settings: Period- 52, Close
Step 4- Add this indicator - Investment Bottom Indicator
Analysis-
When the William %R value is below -80 & Investment Bottom Indicator value is above 80 : this indicates that the market is near its bottom and if you have not yet started investing yet, this is the right time before the market flies off (in very few weeks/months) & you miss the bus!
保護スクリプト
このスクリプトのソースコードは非公開で投稿されています。 ただし、制限なく自由に使用できます – 詳細はこちらでご確認ください。
免責事項
この情報および投稿は、TradingViewが提供または推奨する金融、投資、トレード、その他のアドバイスや推奨を意図するものではなく、それらを構成するものでもありません。詳細は利用規約をご覧ください。
免責事項
この情報および投稿は、TradingViewが提供または推奨する金融、投資、トレード、その他のアドバイスや推奨を意図するものではなく、それらを構成するものでもありません。詳細は利用規約をご覧ください。