OPEN-SOURCE SCRIPT
Bollinger Bands (with Width/GaUGE)
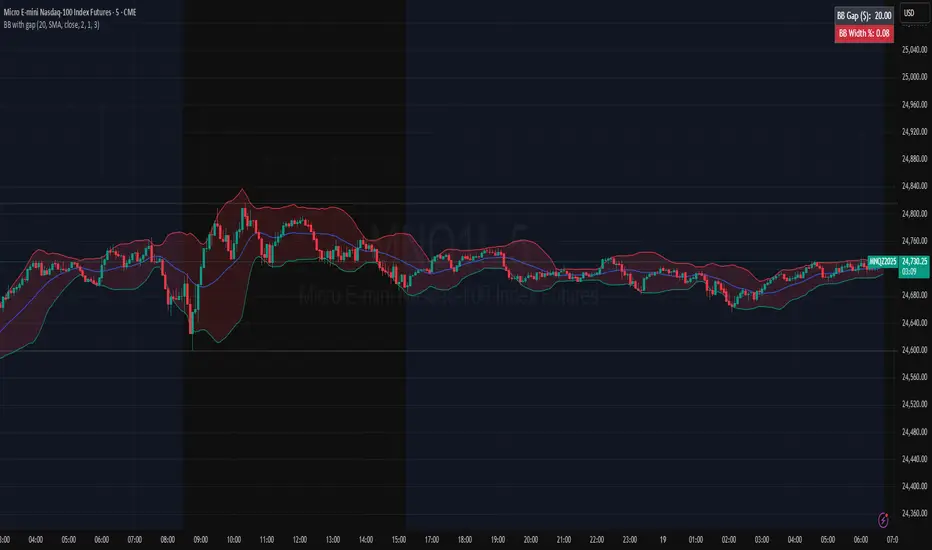
This overlay plots standard Bollinger Bands and makes volatility obvious. The fill between bands is color-coded by band width (tight = red “squeeze”, wide = teal “expansion”, mid = yellow). A compact table (top-right) shows live BB Gap ($) and BB Width (%), and the width also appears in the status line. Thresholds for squeeze/expansion are user-set. Use it to avoid low-volatility chop and time breakouts when width expands.
オープンソーススクリプト
TradingViewの精神に則り、この作者はスクリプトのソースコードを公開しているので、その内容を理解し検証することができます。作者に感謝です!無料でお使いいただけますが、このコードを投稿に再利用する際にはハウスルールに従うものとします。
免責事項
これらの情報および投稿は、TradingViewが提供または保証する金融、投資、取引、またはその他の種類のアドバイスや推奨を意図したものではなく、またそのようなものでもありません。詳しくは利用規約をご覧ください。
オープンソーススクリプト
TradingViewの精神に則り、この作者はスクリプトのソースコードを公開しているので、その内容を理解し検証することができます。作者に感謝です!無料でお使いいただけますが、このコードを投稿に再利用する際にはハウスルールに従うものとします。
免責事項
これらの情報および投稿は、TradingViewが提供または保証する金融、投資、取引、またはその他の種類のアドバイスや推奨を意図したものではなく、またそのようなものでもありません。詳しくは利用規約をご覧ください。