OPEN-SOURCE SCRIPT
更新済 PanelWithGrid v1.7
PanelWithGrid v1.7 - Advanced Multi-Timeframe Grid and Panel Indicator
DESCRIPTION:
PanelWithGrid v1.7 is a comprehensive tool for traders who want to monitor multiple timeframes simultaneously while operating based on a customizable price grid. This indicator combines two essential functionalities in a single script:
🎯 MAIN FEATURES:
✅ CUSTOMIZABLE GRID SYSTEM
Configurable timeframe for the grid base (1M to Monthly)
Selection of the reference candlestick level (0 = current, 1 = previous, etc.)
NEW: Custom price as the grid base
Adjustable distance between lines in points
Colored lines (red = base, blue = above, gold = below)
Informative label with the base value
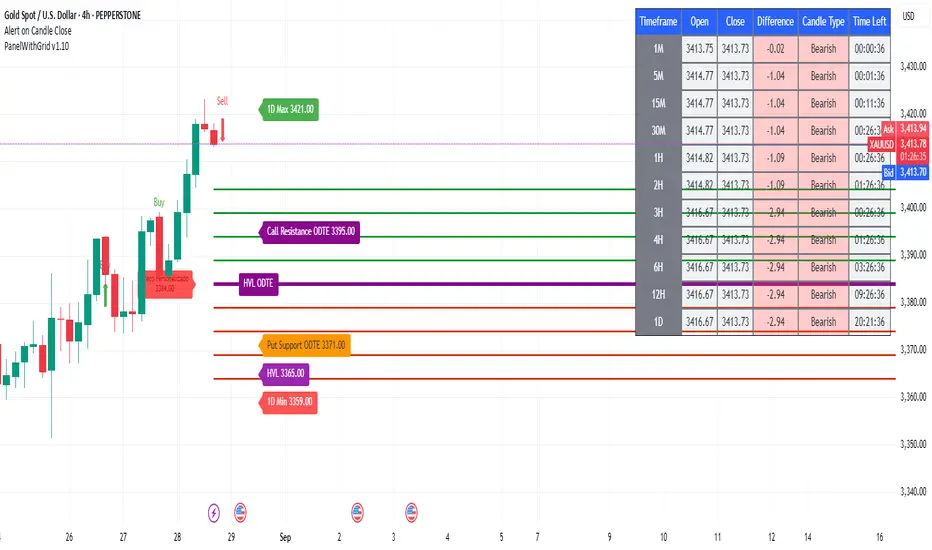
✅ COMPLETE MULTI-TIMEFRAME DASHBOARD
Monitoring of 11 timeframes: 1M, 5M, 15M, 30M, 1H, 2H, 3H, 4H, 6H, 12H, and 1D
Real-time data: open, close, difference, and candlestick type
Countdown to close Each candle
Intuitive colors (green for bullish, red for bearish)
✅ CONFLUENCE SYSTEM
Visual and audio alerts for bullish/bearish confluence on all timeframes
Special confluence analysis for 1H candles after 30 minutes of formation
Buy/sell arrows on the chart for clear signals
⚙️ MAIN SETTINGS:
Grid Settings:
Timeframe for Grid: Select the period for the baseline
Candle Level: 0 (current candle), 1 (last candle), etc.
Grid Distance: Distance between lines in points
NEW: Use Custom Price - Enables manual price as a base
Custom Close Price - Sets the manual value for the grid
🎨 VISUAL:
Grid with lines extended to the right
Panel positioned in the upper left corner
Colors organized for easy interpretation
Informative labels directly on the chart
🔔 ADVANCED FEATURES:
Alerts configured for confluences
Optimized for performance
Real-time updates
Compatible with all pairs and markets
PERFECT FOR:
Scalpers and day traders
Level-based trading
Multiple timeframe analysis
Reversal and breakout strategies
UPDATE v1.7:
Added custom price option for the grid
Improved line stability
Performance optimization
Bug fixes minors
INSTRUCTIONS FOR USE:
Apply the indicator to the chart
Set the desired timeframe and level for the grid
Adjust the distance between lines according to your strategy
Use the custom price if you want a specific basis
Monitor the dashboard to see the convergence between timeframes
Trade based on the identified confluences
DESCRIPTION:
PanelWithGrid v1.7 is a comprehensive tool for traders who want to monitor multiple timeframes simultaneously while operating based on a customizable price grid. This indicator combines two essential functionalities in a single script:
🎯 MAIN FEATURES:
✅ CUSTOMIZABLE GRID SYSTEM
Configurable timeframe for the grid base (1M to Monthly)
Selection of the reference candlestick level (0 = current, 1 = previous, etc.)
NEW: Custom price as the grid base
Adjustable distance between lines in points
Colored lines (red = base, blue = above, gold = below)
Informative label with the base value
✅ COMPLETE MULTI-TIMEFRAME DASHBOARD
Monitoring of 11 timeframes: 1M, 5M, 15M, 30M, 1H, 2H, 3H, 4H, 6H, 12H, and 1D
Real-time data: open, close, difference, and candlestick type
Countdown to close Each candle
Intuitive colors (green for bullish, red for bearish)
✅ CONFLUENCE SYSTEM
Visual and audio alerts for bullish/bearish confluence on all timeframes
Special confluence analysis for 1H candles after 30 minutes of formation
Buy/sell arrows on the chart for clear signals
⚙️ MAIN SETTINGS:
Grid Settings:
Timeframe for Grid: Select the period for the baseline
Candle Level: 0 (current candle), 1 (last candle), etc.
Grid Distance: Distance between lines in points
NEW: Use Custom Price - Enables manual price as a base
Custom Close Price - Sets the manual value for the grid
🎨 VISUAL:
Grid with lines extended to the right
Panel positioned in the upper left corner
Colors organized for easy interpretation
Informative labels directly on the chart
🔔 ADVANCED FEATURES:
Alerts configured for confluences
Optimized for performance
Real-time updates
Compatible with all pairs and markets
PERFECT FOR:
Scalpers and day traders
Level-based trading
Multiple timeframe analysis
Reversal and breakout strategies
UPDATE v1.7:
Added custom price option for the grid
Improved line stability
Performance optimization
Bug fixes minors
INSTRUCTIONS FOR USE:
Apply the indicator to the chart
Set the desired timeframe and level for the grid
Adjust the distance between lines according to your strategy
Use the custom price if you want a specific basis
Monitor the dashboard to see the convergence between timeframes
Trade based on the identified confluences
リリースノート
CHANGE DESCRIPTION - PANELWITHGRID V1.81. CALL RESISTANCE ODTE / GAMMA WALL ODTE IMPLEMENTATION
Added new input field for manual entry of Call Resistance ODTE price level
Created horizontal line at specified price level, matching the visual pattern of HVL ODTE line:
Color: purple (RGB 137, 10, 141)
Width: 4 pixels
Extension: to the right
Style: solid (consistent with HVL ODTE)
2. DESCRIPTIVE LABEL FOR CALL RESISTANCE
Implemented "Call Res. ODTE" label following the exact same pattern as "HVL ODTE" label:
Positioning: 5 bars to the right of origin point
Format: text-only without price value
Colors: purple background with white text
Style: centered label
Size: normal
3. TECHNICAL CORRECTIONS
Fixed variable scope error for x_pos within Call Resistance logic block
Corrected text concatenation syntax error in label
Ensured visual consistency between both elements (HVL and Call Resistance)
4. FUNCTIONALITY
Call Resistance ODTE operates independently from the main grid
Updates dynamically when input value is modified
Maintains persistence on chart without unnecessary redrawing
FINAL RESULT
Two consistent and harmonious visual elements on the chart:
✅ HVL ODTE: Line + label at grid base level
✅ Call Resistance ODTE: Line + label at specified resistance level
リリースノート
Removed call resistance lineリリースノート
Missing timeframes have been addedリリースノート
🎯 NEW VERSION - PANELWITHGRID v1.10 🎯📈 SIGNIFICANT ENHANCEMENTS:
✅ NEW CUSTOM LEVELS - Now you can add up to 7 custom price levels:
🔹 Call Resistance ODTE / Gamma Wall ODTE
🔹 HVL (High Volume Level)
🔹 1D Max (Daily High)
🔹 1D Min (Daily Low)
🔹 Put Support ODTE
🔹 Put Support
🔹 Call Resistance
🎨 VISUAL UPGRADE:
✅ Distinct colors for each level type (easy visual identification)
✅ Informative labels show level name + price value
✅ Smart positioning on the right side of the chart
✅ Clean design without element overlap
⚡ KEY FEATURES:
✅ Automatic updates when values change
✅ Level persistence between sessions
✅ Compatible with all timeframes
✅ Integrated with existing grid system
🛠 HOW TO USE:
Enter desired values in the new input fields
Levels will automatically appear on the chart
Each level has unique color for easy identification
Use alongside the grid for complete market analysis
🎯 PERFECT FOR:
Day traders and swing traders
Support and resistance analysis
Key market level identification
Price action trading strategies
👉 UPGRADE NOW and take your technical analysis to the next level!
オープンソーススクリプト
TradingViewの精神に則り、このスクリプトの作者はコードをオープンソースとして公開してくれました。トレーダーが内容を確認・検証できるようにという配慮です。作者に拍手を送りましょう!無料で利用できますが、コードの再公開はハウスルールに従う必要があります。
免責事項
この情報および投稿は、TradingViewが提供または推奨する金融、投資、トレード、その他のアドバイスや推奨を意図するものではなく、それらを構成するものでもありません。詳細は利用規約をご覧ください。
オープンソーススクリプト
TradingViewの精神に則り、このスクリプトの作者はコードをオープンソースとして公開してくれました。トレーダーが内容を確認・検証できるようにという配慮です。作者に拍手を送りましょう!無料で利用できますが、コードの再公開はハウスルールに従う必要があります。
免責事項
この情報および投稿は、TradingViewが提供または推奨する金融、投資、トレード、その他のアドバイスや推奨を意図するものではなく、それらを構成するものでもありません。詳細は利用規約をご覧ください。