OPEN-SOURCE SCRIPT
更新済 Pinks MultiRSI
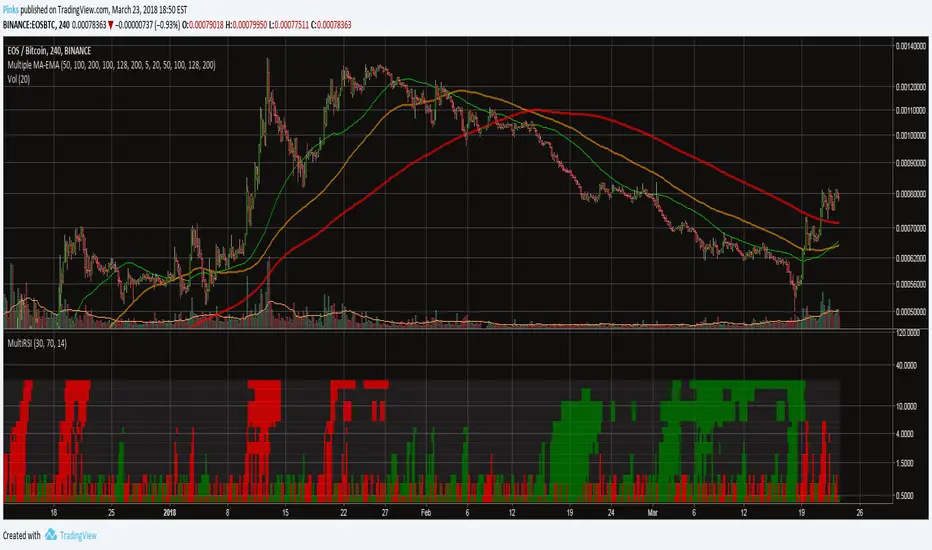
An indicator that displays whether RSI is oversold, undersold, or neutral, on several timeframes:
15m, 30m, 45m, 1h, 2h, 3h, 4h, 5h, 6h, 12h, 18h, 1D.
If RSI for a specific interval is overbought, the bars for that interval turn red (for "sell"). If it is oversold, it turns green (for "buy"). The RSI length, oversold level, and overbought level are tuneable.
The bottom row of coloumns is 15m RSI, top row is 1D RSI. It is recommended to use log scale on this indicator. The bar height is proportional to the interval it cover.
リリースノート
**NEW FEATURES**/b]You can now set multiple levels of overbought and oversold! The columns will be colored according to how oversold or overbought the RSI is. This will help you get a clearer image of the RSI on all timeframes.
リリースノート
Fixed bug where 5h RSI was set to 4h.リリースノート
Changed chart imageオープンソーススクリプト
TradingViewの精神に則り、このスクリプトの作者はコードをオープンソースとして公開してくれました。トレーダーが内容を確認・検証できるようにという配慮です。作者に拍手を送りましょう!無料で利用できますが、コードの再公開はハウスルールに従う必要があります。
免責事項
この情報および投稿は、TradingViewが提供または推奨する金融、投資、トレード、その他のアドバイスや推奨を意図するものではなく、それらを構成するものでもありません。詳細は利用規約をご覧ください。
オープンソーススクリプト
TradingViewの精神に則り、このスクリプトの作者はコードをオープンソースとして公開してくれました。トレーダーが内容を確認・検証できるようにという配慮です。作者に拍手を送りましょう!無料で利用できますが、コードの再公開はハウスルールに従う必要があります。
免責事項
この情報および投稿は、TradingViewが提供または推奨する金融、投資、トレード、その他のアドバイスや推奨を意図するものではなく、それらを構成するものでもありません。詳細は利用規約をご覧ください。