OPEN-SOURCE SCRIPT
更新済 Stochastic RSI with crossover-indication and alerts
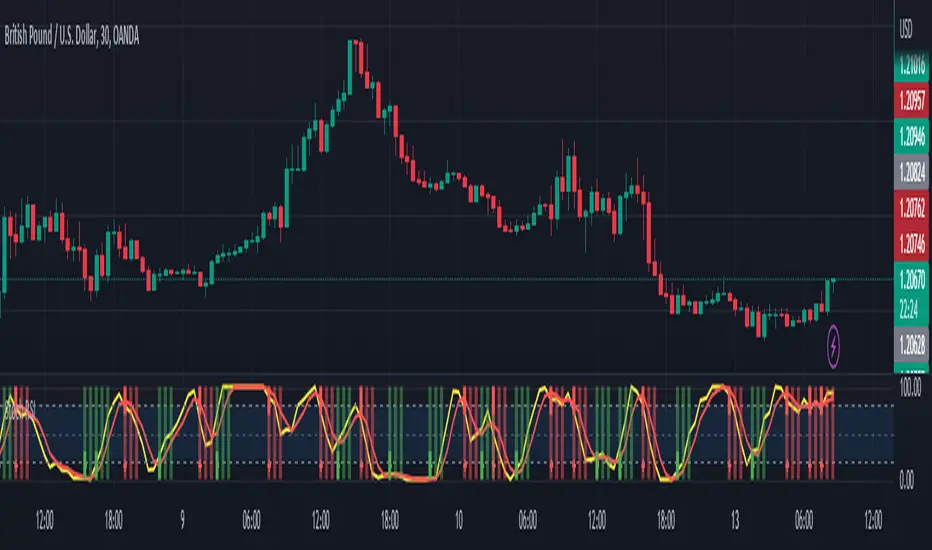
On the normal Stochastic RSI it may be hard to see the exact crosses between the two lines. This version makes that a little easier.
Shows green line when K-line crosses up the D-line, but below the 50-level (this treshold level can be adjusted in the settings).
Shows red line when K-line crosses down the D-line, but above the 50-level (treshold level can be adjusted).
Option to show lines on the subsequent one or two bars. For instance you can use a rule that a crossover is still valid for trade-entry when it happened 2 bars ago.
リリースノート
Cleaned up the code.Linewidth can now be adjusted.
In the style-settings you can get rid of the vertical lines, leaving just a tiny cross as an indication where the K and D have crossed.
リリースノート
New version can generate alerts with crossover / crossunder,but with additional condition that candle itself is bulllish (green) or bearish (red).リリースノート
.オープンソーススクリプト
TradingViewの精神に則り、このスクリプトの作者はコードをオープンソースとして公開してくれました。トレーダーが内容を確認・検証できるようにという配慮です。作者に拍手を送りましょう!無料で利用できますが、コードの再公開はハウスルールに従う必要があります。
免責事項
この情報および投稿は、TradingViewが提供または推奨する金融、投資、トレード、その他のアドバイスや推奨を意図するものではなく、それらを構成するものでもありません。詳細は利用規約をご覧ください。
オープンソーススクリプト
TradingViewの精神に則り、このスクリプトの作者はコードをオープンソースとして公開してくれました。トレーダーが内容を確認・検証できるようにという配慮です。作者に拍手を送りましょう!無料で利用できますが、コードの再公開はハウスルールに従う必要があります。
免責事項
この情報および投稿は、TradingViewが提供または推奨する金融、投資、トレード、その他のアドバイスや推奨を意図するものではなく、それらを構成するものでもありません。詳細は利用規約をご覧ください。