INVITE-ONLY SCRIPT
更新済 TB Momentum/Volume Indicator, MTF
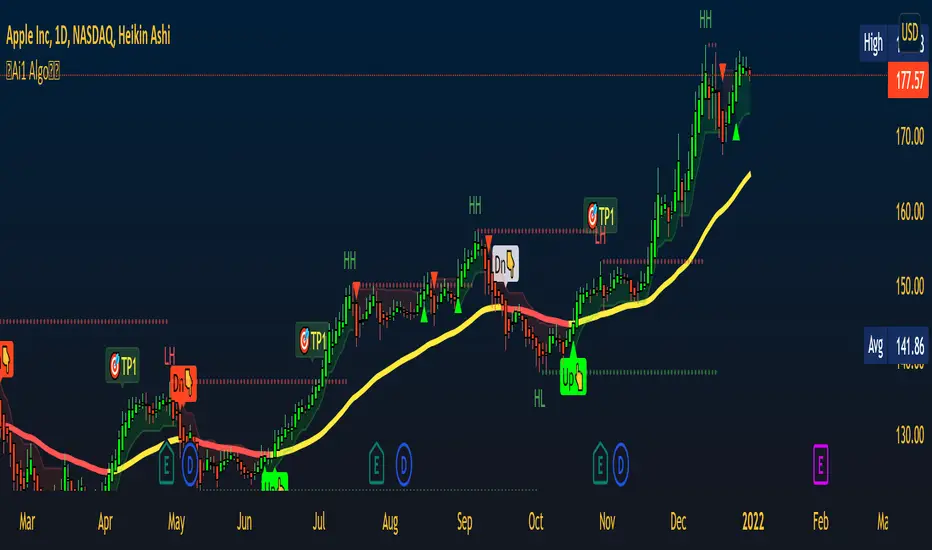
This Indicator Merges The Best Parts Of The Macd, Vortex, Volume, Ichimoku Cloud, Bollinger Bands, Atr, And Rsi Indicators.
The Idea Is To Signal Important Sectors Of The Chart Were All Or Some Of These Indicators Are Giving The Same Signals.
This Indicator Consist Of 3 Parts The Signaling Indicator Which Goes On As A Layout On Top On The Price Action (Candles), An Indicator Called (TB Macd /Momentum Squeeze) That Shows The Actual Macd With A 0 Line Merging With The Momentum Squeeze. The Third Part Is The (TB Rsi Indicator) Which Signals Overbought And Oversold Areas. These 3 Indicators Are Given For Free But Are Only For Premium Members For The Trading Bullies Premium Service.
To Get Access Please Send A Private Message
After You Have Been Given Access You Can Find The Indicators On The Invite Only Scripts
Instructions:
After Applying To Your Chart You Should See On The Left Part Of Your Screen Where Your Indicator Labels Are “TD-Mom/Vol” Click On The Settings To Start The Setup
-The Macd Settings
- The First 5 Checkmarks Go Untouched
- The Settings Can Be Left Standard Or They Can Be Changed To 8-17-9 For Faster Signals. 8-17-9 Are My Settings
-Vortex Settings
- The Vortex Periods Can Be Set To 12 For Faster Signals Or To 14. 12 Is My Go-To Setting
-The Ichimoku Filter
- When This Is Activated It Decreases Significantly The Signals And Should Only Be Turn On If You Only Wish To Receive Signals When The Macd, Vortex, And Ichimoku Conversion Line And Baseline Crosses Around The Same Areas. I Generally Leave It Off
-Volume Filter
- When The Volume Filter Is Activated The Alerts Will Only Come Up If The Volume Is Above The 20 Ma. This Can Be Changed As Well But In General 20 Ma Is The Best For All Markets. I Leave This At 20 Ma The Macd 0 Line Filter
-Macd 0 Line Filter
- This Filter When Activated Will Only Give Signals When The Macd Crosses Up Below The 0 Line For Longs And Above The 0 Line For Shorts. I Generally Leave This Off
-Rsi Filter
- This Filter Will Create A Grey Signal When The Signal Is Given On Overbought Or Oversold Areas. Settings Should Be Left At 12 Or 14 And Then 70-30. I Leave This On
-The Cloud Squeeze
- The Cloud Squeeze Is A Visual Indicator That Marks The Trend Green Cloud Is Trend Up And Red Cloud Is Trend Down. The Wider The Cloud The More Resistance Its Got Below Or Above. Settings For This Should Be 10-40 Resolution Depending On The Timeframe You Are Working On
-The Momentum Squeeze
- Momentum Squeeze Will Signal A Triangle Above Or Below The Candles To Signal The Strength Of the Trend. This Is Very Helpful On Lower Timeframes 1m - 5m To Signal When The Trend Is Losing Steam. You Can Set The Bollinger Band Ratio On And Use The Henkin Ashi Optimization When Using Those Kinds Of Candles.
- Style******
- The Style Tab Is Very Personal But I Like The Below Settings
- First Shape Label Up Below Bar, First Color 9598a1 - Second Color 00e676
- Second Shape Label Down Above Bar First Color 9598a1 And Second Color Ff5252
- Short And Long Leading Ema Are Already Set
- Momentum Positive & Up With Triangle Up Above Bar Color 4caf50
- Momentum Positive & Down With Triangle Down Above Bar Color 1b5e20
- Momentum Negative & Up With Triangle Up Below Bar Color Ffeb3b
- Momentum Negative & Down Triangle Down Below Bar Color Ff5252
- Ma Cloud Left As-Is.
Functionality:
Labels
These Labels Are Best Used Un Longer Timeframes 1hr+++
-Cross+Up Green - Momentum And Volume Are High, Possibilities For A Long/Call In The Market
-Cross+Up Grey - Momentum And Volume Are High. Possibilities For A Long/Call In The Market But Signal Is Presented In Overbought Area Of The Rsi
-Cross-Down Red - Momentum And Volume Are High Possibilities For Short/Put In The Market
-Cross-Down Grey - Momentum And Volume Are High Possibilities For Short/Put In The Market But Signal Is Presented On Oversold Area Of The Rsi
Cloud
Very Important To Not******* Take Any Trades From The Above Labels When The Cloud Is Thin, This Indicator Measures Trending Markets And When There Is No Trend Or A Range Market The Signals Are To Be Disregarded*******
-When Cloud Is Green The Trend Is Upwards And You Should Look To Long/Call The Market. Try Not To Take Any Puts/Shorts As You Will Be Going Against The Trend
-When Cloud Is Red The Trend Is Down And You Should Look To Short/Put The Market. Try Not To Take Any Call/Longs As You Will Be Going Against The Trend
Momentum Triangles On Top Of The Candles
-There Are Made To Be Used In Lower Timeframes 1m -5m -15m
-These Are Good Once You Are In A Position And You Want To Get A Closer Look At The Trend.
-Green Arrow Up Signals High Momentum Up Buyers In Control
-Blue Arrow On Top Downwards Signals Uptrend Is Losing Steam
-Orange Arrow Below Upwards Signals Down Momentum Is Losing Steam
-Red Arrow Below Signals Momentum Is Down Sellers In Control
リリースノート
This Indicator Merges The Best Parts Of The Macd , Vortex , Volume , Ichimoku Cloud , Bollinger Bands , Atr, And Rsi Indicators.The Idea Is To Signal Important Sectors Of The Chart Were All Or Some Of These Indicators Are Giving The Same Signals.
This Indicator Consist Of 3 Parts The Signaling Indicator Which Goes On As A Layout On Top On The Price Action (Candles), An Indicator Called (TB Macd /Momentum Squeeze) That Shows The Actual Macd With A 0 Line Merging With The Momentum Squeeze. The Third Part Is The (TB Rsi Indicator) Which Signals Overbought And Oversold Areas. These 3 Indicators Are Given For Free But Are Only For Premium Members For The Trading Bullies Premium Service.
After You Have Been Given Access You Can Find The Indicators On The Invite Only Scripts
Instructions:
After Applying To Your Chart You Should See On The Left Part Of Your Screen Where Your Indicator Labels Are “TD-Mom/Vol” Click On The Settings To Start The Setup
-Volume Filter
- When The Volume Filter Is Activated The Alerts Will Only Come Up If The Volume Is Above The 20 Ma. This Can Be Changed As Well But In General 20 Ma Is The Best For All Markets. I Leave This At 20 Ma The Macd 0 Line Filter
-Macd 0 Line Filter
- This Filter When Activated Will Only Give Signals When The Macd Crosses Up Below The 0 Line For Longs And Above The 0 Line For Shorts. I Generally Leave This Off
-Rsi Filter
- This Filter Will Create A Grey Signal When The Signal Is Given On Overbought Or Oversold Areas. Settings Should Be Left At 12 Or 14 And Then 70-30. I Leave This On
-The Cloud Squeeze
- The Cloud Squeeze Is A Visual Indicator That Marks The Trend Green Cloud Is Trend Up And Red Cloud Is Trend Down. The Wider The Cloud The More Resistance Its Got Below Or Above. Settings For This Should Be 10-40 Resolution Depending On The Timeframe You Are Working On
-The Momentum Squeeze
- Momentum Squeeze Will Signal A Triangle Above Or Below The Candles To Signal The Strength Of the Trend. This Is Very Helpful On Lower Timeframes 1m - 5m To Signal When The Trend Is Losing Steam. You Can Set The Bollinger Band Ratio On And Use The Henkin Ashi Optimization When Using Those Kinds Of Candles.
Functionality:
Labels
These Labels Are Best Used Un Longer Timeframes 1hr+++
-Cross+Up Green - Momentum And Volume Are High, Possibilities For A Long/Call In The Market
-Cross+Up Grey - Momentum And Volume Are High. Possibilities For A Long/Call In The Market But Signal Is Presented In Overbought Area Of The Rsi
-Cross-Down Red - Momentum And Volume Are High Possibilities For Short/Put In The Market
-Cross-Down Grey - Momentum And Volume Are High Possibilities For Short/Put In The Market But Signal Is Presented On Oversold Area Of The Rsi
Cloud
Very Important To Not******* Take Any Trades From The Above Labels When The Cloud Is Thin, This Indicator Measures Trending Markets And When There Is No Trend Or A Range Market The Signals Are To Be Disregarded*******
-When Cloud Is Green The Trend Is Upwards And You Should Look To Long/Call The Market. Try Not To Take Any Puts/Shorts As You Will Be Going Against The Trend
-When Cloud Is Red The Trend Is Down And You Should Look To Short/Put The Market. Try Not To Take Any Call/Longs As You Will Be Going Against The Trend
Momentum Triangles On Top Of The Candles
-There Are Made To Be Used In Lower Timeframes 1m -5m -15m
-These Are Good Once You Are In A Position And You Want To Get A Closer Look At The Trend.
-Green Arrow Up Signals High Momentum Up Buyers In Control
-Blue Arrow On Top Downwards Signals Uptrend Is Losing Steam
-Orange Arrow Below Upwards Signals Down Momentum Is Losing Steam
-Red Arrow Below Signals Momentum Is Down Sellers In Control
Added in 2.1... SL-TP1-TP2 / EMA Trend color candles / ADX filter
To Get Access Please Send A Private Message
リリースノート
This new optimized version provide swing trade trend idea based 50ma and it provides better signals and alertsリリースノート
2.3 Adds MA and Vwap Filters リリースノート
Polished visuals and added tweaks to provide better signals on choppy marketリリースノート
Updated for automatic timeframe adjustment リリースノート
Minor fixes of bugsリリースノート
Added better support & Resistance levelsリリースノート
rolling back to version 2.4.1 while fixing issues with trade manager version 2.5リリースノート
Added Price action Inside and outside bars with alertsリリースノート
Added Doji candle color codeリリースノート
Minor fixesリリースノート
Version 2.4.3 added the second ma fixed minimal bugsリリースノート
minor bug fixesリリースノート
Minor bugs and fixesリリースノート
MINOR BUG FIXESリリースノート
Minor fixesリリースノート
Minor bugs and fixes招待専用スクリプト
このスクリプトは作者が承認したユーザーのみアクセス可能です。使用するにはアクセス申請をして許可を得る必要があります。通常は支払い後に承認されます。詳細は下記の作者の指示に従うか、TradingBulliesに直接お問い合わせください。
TradingViewは、作者を完全に信頼し、スクリプトの動作を理解していない限り、有料スクリプトの購入・使用を推奨しません。コミュニティスクリプトには無料のオープンソースの代替が多数あります。
作者の指示
Please head to https://en.tradingbullies.com/ai1algo
免責事項
この情報および投稿は、TradingViewが提供または推奨する金融、投資、トレード、その他のアドバイスや推奨を意図するものではなく、それらを構成するものでもありません。詳細は利用規約をご覧ください。
招待専用スクリプト
このスクリプトは作者が承認したユーザーのみアクセス可能です。使用するにはアクセス申請をして許可を得る必要があります。通常は支払い後に承認されます。詳細は下記の作者の指示に従うか、TradingBulliesに直接お問い合わせください。
TradingViewは、作者を完全に信頼し、スクリプトの動作を理解していない限り、有料スクリプトの購入・使用を推奨しません。コミュニティスクリプトには無料のオープンソースの代替が多数あります。
作者の指示
Please head to https://en.tradingbullies.com/ai1algo
免責事項
この情報および投稿は、TradingViewが提供または推奨する金融、投資、トレード、その他のアドバイスや推奨を意図するものではなく、それらを構成するものでもありません。詳細は利用規約をご覧ください。