OPEN-SOURCE SCRIPT
Qossai Stock Info
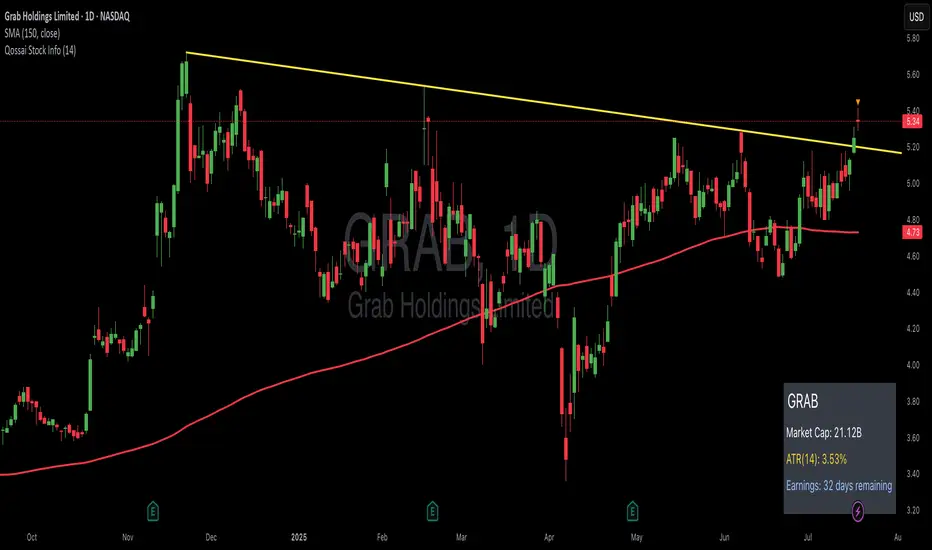
### Qossai Stock Info Indicator
This indicator provides a concise overlay of essential stock information directly on your chart, presented in a clean, organized table. Designed for quick glances, it helps traders and investors stay informed about key fundamental and volatility metrics of the currently viewed symbol.
**Key Features:**
* **Symbol/Ticker Display:** Clearly shows the ticker of the asset you are currently viewing.
* **Dynamic Market Capitalization (Market Cap):** Automatically calculates and displays the market capitalization in a readable format (Millions, Billions, or Trillions), providing instant insight into the company's size.
* **Average True Range (ATR) as Percentage:** Shows the 14-day Average True Range (a measure of volatility) as a percentage of the closing price, helping you gauge the typical price movement. The ATR period is customizable.
* **Earnings Countdown:** Keep track of upcoming events with a precise countdown displaying the number of days remaining until the next earnings announcement. This feature can be toggled on or off via the indicator's settings.
* **Clean Table Format:** All information is presented neatly in a table with a subtle black background, ensuring readability without cluttering your main chart view.
**How to Use:**
Simply add the "Qossai Stock Info" indicator to your chart. You can adjust the ATR length and toggle the earnings countdown visibility from the indicator's settings.
**Purpose:**
This tool aims to simplify access to critical stock data, empowering users to make quicker, more informed decisions by having vital information readily available on their screen.
---
オープンソーススクリプト
TradingViewの精神に則り、このスクリプトの作者はコードをオープンソースとして公開してくれました。トレーダーが内容を確認・検証できるようにという配慮です。作者に拍手を送りましょう!無料で利用できますが、コードの再公開はハウスルールに従う必要があります。
免責事項
この情報および投稿は、TradingViewが提供または推奨する金融、投資、トレード、その他のアドバイスや推奨を意図するものではなく、それらを構成するものでもありません。詳細は利用規約をご覧ください。
オープンソーススクリプト
TradingViewの精神に則り、このスクリプトの作者はコードをオープンソースとして公開してくれました。トレーダーが内容を確認・検証できるようにという配慮です。作者に拍手を送りましょう!無料で利用できますが、コードの再公開はハウスルールに従う必要があります。
免責事項
この情報および投稿は、TradingViewが提供または推奨する金融、投資、トレード、その他のアドバイスや推奨を意図するものではなく、それらを構成するものでもありません。詳細は利用規約をご覧ください。