OPEN-SOURCE SCRIPT
Slope Averages
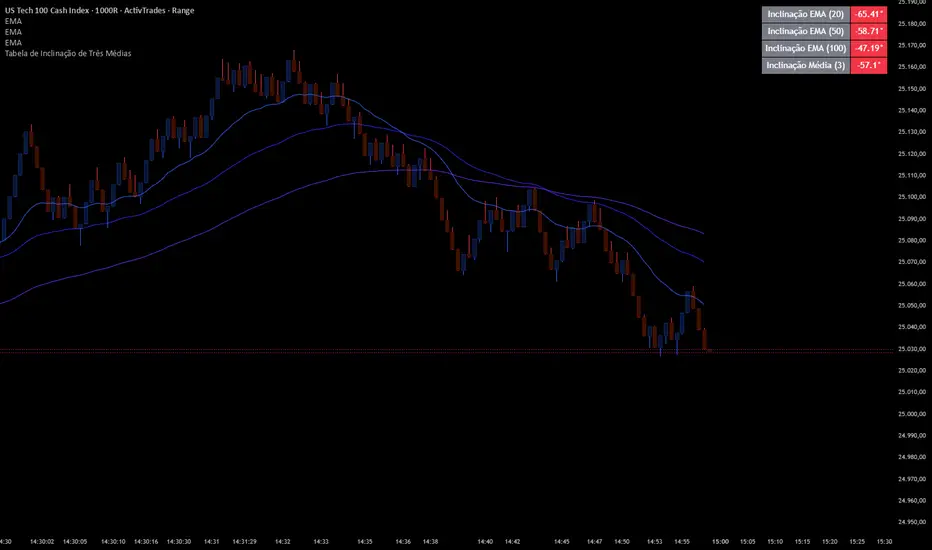
📊 Indicator Overview: Three Moving Averages Slope Table
This indicator is designed to calculate and display the slopes and averages of three different moving averages (MAs) in a table format. It helps traders quickly visualize the direction and strength of multiple moving averages, as well as their combined averages, across different timeframes.
⚙️ Inputs and Configuration
• MA Type 1, 2, 3: Choose the type of moving average for each line. Options:
• (Exponential Moving Average)
• (Simple Moving Average)
• (Weighted Moving Average)
• (Volume-Weighted Moving Average)
• (a custom smoother using multiple EMAs)
• Length 1, 2, 3: Periods for each moving average (e.g., 20, 50, 100).
• Source: The price source used (default = ).
• Extra Timeframes (optional): You can configure up to 3 additional timeframes (e.g., 1h, 4h, Daily) to compare the combined average across different chart periods.
🔧 Functions Explained
1. tilson(src, length)
• A custom moving average that smooths price using 8 sequential EMAs.
• Produces a smoother line than a standard EMA.
2. getMA(src, length, maType)
• Selects the correct moving average type based on user input.
• Returns the chosen MA value.
3. Slope Calculation
• Each slope is calculated as:
• This converts the difference between current and previous MA values into an angle in degrees.
• Positive slope = upward trend, negative slope = downward trend.
4. Combined Slopes
• : Average slope of all three MAs.
• , , : Average slopes of pairs of MAs.
5. Combined Averages
• : Average of MA1 and MA2.
• : Average of MA2 and MA3.
• : Average of MA1 and MA3.
• : Average of all three MAs.
6. Color Function
• : Returns green if value ≥ 0, red if value < 0.
• Used to color table cells for quick visual feedback.
📋 Table Output
The table shows:
1. Individual slopes of MA1, MA2, MA3.
2. Average slope of all three.
3. Combined averages (M1+M2, M2+M3, M1+M3).
4. Combined slopes of pairs.
5. Overall average .
6. Optional: RSI or multi-timeframe averages can also be added.
Each value cell is colored green if positive, red if negative, making it easy to spot bullish or bearish conditions.
🎯 How to Use It
• Trend Strength: Look at the slope values. Steeper positive slopes = stronger uptrend; steep negative slopes = stronger downtrend.
• Confluence: When all three MAs and their combined averages point in the same direction, it signals strong trend alignment.
• Multi-Timeframe Analysis: Configure extra timeframes to see if short-term and long-term averages agree. If they align, confidence in the trend increases.
• RSI Integration (optional): Add RSI to confirm momentum. For example, bullish slope + RSI > 50 = stronger buy signal.
✅ Practical Example
• MA1 = EMA(20), MA2 = SMA(50), MA3 = WMA(100).
• If slope1, slope2, slope3 are all positive and green, and is also green → strong bullish trend.
• If slopes are mixed (some green, some red), the market is consolidating.
• If all slopes are red and is red → strong bearish trend.
オープンソーススクリプト
TradingViewの精神に則り、このスクリプトの作者はコードをオープンソースとして公開してくれました。トレーダーが内容を確認・検証できるようにという配慮です。作者に拍手を送りましょう!無料で利用できますが、コードの再公開はハウスルールに従う必要があります。
免責事項
この情報および投稿は、TradingViewが提供または推奨する金融、投資、トレード、その他のアドバイスや推奨を意図するものではなく、それらを構成するものでもありません。詳細は利用規約をご覧ください。
オープンソーススクリプト
TradingViewの精神に則り、このスクリプトの作者はコードをオープンソースとして公開してくれました。トレーダーが内容を確認・検証できるようにという配慮です。作者に拍手を送りましょう!無料で利用できますが、コードの再公開はハウスルールに従う必要があります。
免責事項
この情報および投稿は、TradingViewが提供または推奨する金融、投資、トレード、その他のアドバイスや推奨を意図するものではなく、それらを構成するものでもありません。詳細は利用規約をご覧ください。