OPEN-SOURCE SCRIPT
更新済 Coloured CCI Histogram V2.0 by JustUncleL
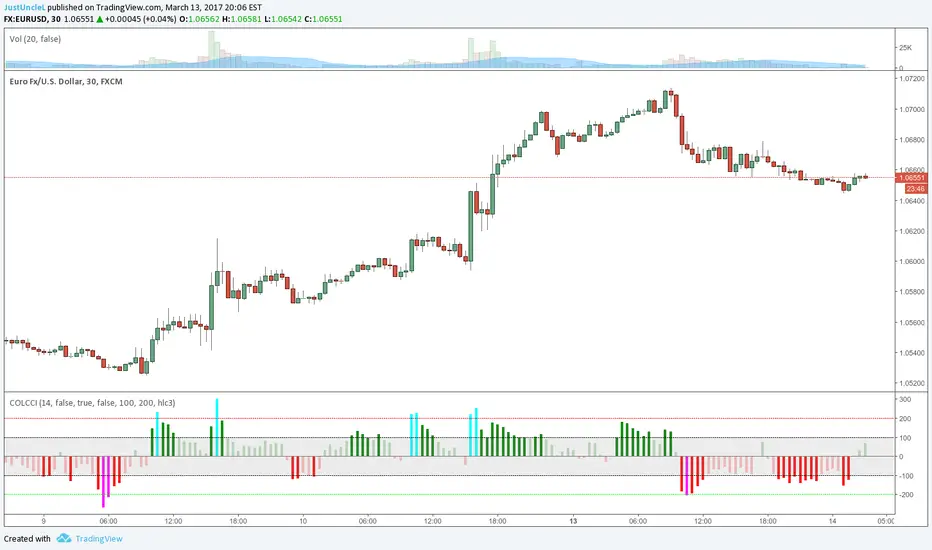
This is a requested update of this script. This is a standard CCI indicator that shows a coloured histogram of important CCI levels, giving a good visual of the CCI levels. Added to this version is an extra coloured level +/-200 and an option to calculate CCI with EMA instead of the standard SMA.
CCI LEVELS:
If you would like different colour arrangement just change them in the "Style" settings of the indicator.
CCI LEVELS:
- Light Green - Greater than 0 and less than 100.
- Green - Greater than 100 and less than 200.
- Aqua - Greater than 200.
- Light Red - Less than 0 and greater than -100.
- Red - Less than -100 and greater than -200.
- Magenta - Less than -200.
If you would like different colour arrangement just change them in the "Style" settings of the indicator.
リリースノート
New version adds:- Main chart bar colouring matching CCI levels.
- Option to use Traditional CCI calculations.
オープンソーススクリプト
TradingViewの精神に則り、このスクリプトの作者はコードをオープンソースとして公開してくれました。トレーダーが内容を確認・検証できるようにという配慮です。作者に拍手を送りましょう!無料で利用できますが、コードの再公開はハウスルールに従う必要があります。
JustUncleL
免責事項
この情報および投稿は、TradingViewが提供または推奨する金融、投資、トレード、その他のアドバイスや推奨を意図するものではなく、それらを構成するものでもありません。詳細は利用規約をご覧ください。
オープンソーススクリプト
TradingViewの精神に則り、このスクリプトの作者はコードをオープンソースとして公開してくれました。トレーダーが内容を確認・検証できるようにという配慮です。作者に拍手を送りましょう!無料で利用できますが、コードの再公開はハウスルールに従う必要があります。
JustUncleL
免責事項
この情報および投稿は、TradingViewが提供または推奨する金融、投資、トレード、その他のアドバイスや推奨を意図するものではなく、それらを構成するものでもありません。詳細は利用規約をご覧ください。