PROTECTED SOURCE SCRIPT
Pascal's Market Compression Oscillator
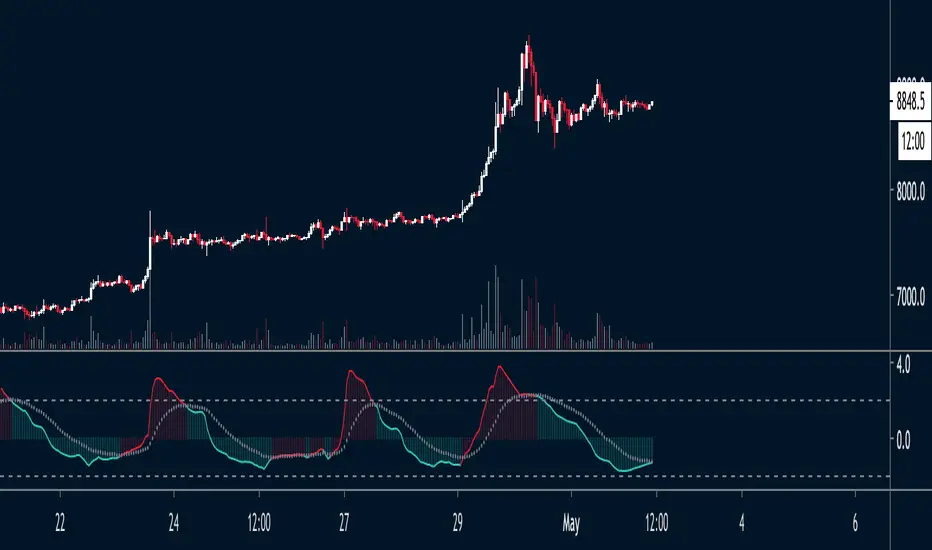
The indicator uses a standardized measure of volume and volatility to visualize the compression state of the market.
- Green: Market is currently compressing
- Red: Market is currently expanding
When the oscillator flips from Green to Red, the market is likely to enter a phase of expansion. This opens a window of opportunity for momentum strategies.
When the oscillator flips from Red to Green, the market is likely to enter a phase of compression. This makes it a favorable regime for mean reversion strategies.
Finally, please note that the indicator is NOT meant for directional analysis. e.g. when the oscillator signals "expansion", that can be up OR down.
保護スクリプト
このスクリプトのソースコードは非公開で投稿されています。 ただし、制限なく自由に使用できます – 詳細はこちらでご確認ください。
免責事項
この情報および投稿は、TradingViewが提供または推奨する金融、投資、トレード、その他のアドバイスや推奨を意図するものではなく、それらを構成するものでもありません。詳細は利用規約をご覧ください。
保護スクリプト
このスクリプトのソースコードは非公開で投稿されています。 ただし、制限なく自由に使用できます – 詳細はこちらでご確認ください。
免責事項
この情報および投稿は、TradingViewが提供または推奨する金融、投資、トレード、その他のアドバイスや推奨を意図するものではなく、それらを構成するものでもありません。詳細は利用規約をご覧ください。