OPEN-SOURCE SCRIPT
Comparaison DXY, VIX, SPX, DJI, GVZ
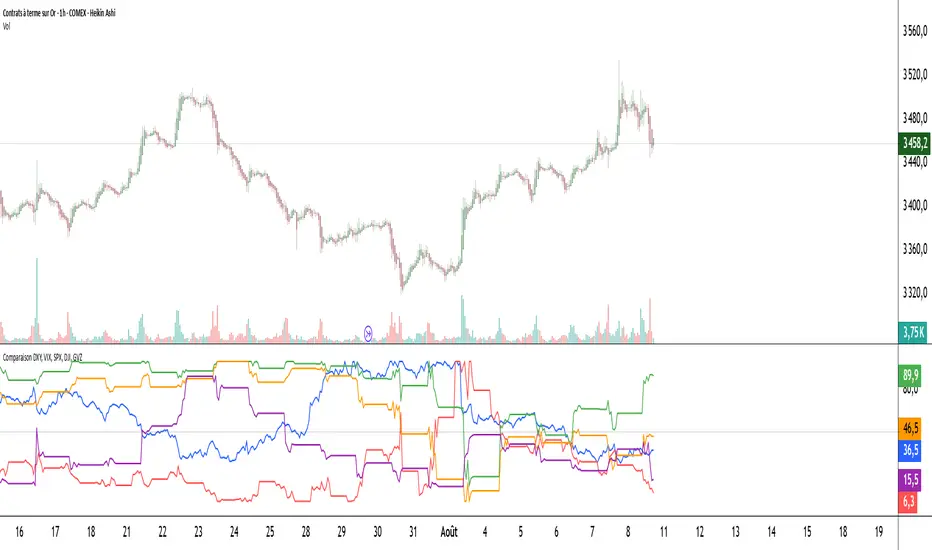
Pine Script indicator compares the normalized values of DXY, VIX, SPX, DJI, and GVZ indices on a single scale from 0 to 100. Here's a breakdown of what it does:
Data Requests: Gets closing prices for:
US Dollar Index (DXY)
VIX Volatility Index
S&P 500 (SPX)
Dow Jones Industrial Average (DJI)
Gold Volatility Index (GVZ)
Normalization: Each index is normalized using a 500-period lookback to scale values between 0-100, making them comparable despite different price scales.
Visualization:
Plots each normalized index with distinct colors
Adds a dotted midline at 50 for reference
Uses thicker linewidth (2) for better visibility
Timeframe Flexibility: Works on any chart timeframe since it uses timeframe.period
This is useful for:
Comparing relative strength/weakness between these key market indicators
Identifying divergences or convergences in their movements
Seeing how different asset classes (currencies, equities, volatility) relate
You could enhance this by:
Adding correlation calculations between pairs
Including options to adjust the normalization period
Adding alerts when instruments diverge beyond certain thresholds
Including volume or other metrics alongside price
オープンソーススクリプト
TradingViewの精神に則り、このスクリプトの作者はコードをオープンソースとして公開してくれました。トレーダーが内容を確認・検証できるようにという配慮です。作者に拍手を送りましょう!無料で利用できますが、コードの再公開はハウスルールに従う必要があります。
免責事項
この情報および投稿は、TradingViewが提供または推奨する金融、投資、トレード、その他のアドバイスや推奨を意図するものではなく、それらを構成するものでもありません。詳細は利用規約をご覧ください。
オープンソーススクリプト
TradingViewの精神に則り、このスクリプトの作者はコードをオープンソースとして公開してくれました。トレーダーが内容を確認・検証できるようにという配慮です。作者に拍手を送りましょう!無料で利用できますが、コードの再公開はハウスルールに従う必要があります。
免責事項
この情報および投稿は、TradingViewが提供または推奨する金融、投資、トレード、その他のアドバイスや推奨を意図するものではなく、それらを構成するものでもありません。詳細は利用規約をご覧ください。