OPEN-SOURCE SCRIPT
更新済 Volume Candles Standardized (VCS)
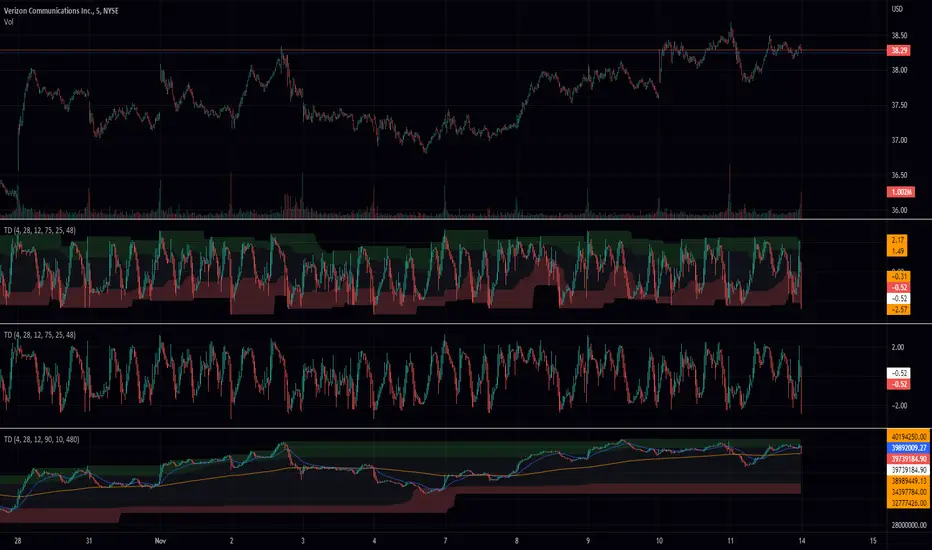
This is an indicator that shows the inflow and outflow of volume into a financial instrument. Volume is likely one of the most underrated source of data in trading unfortunately so there seems to be a lack of studies on it. The size of the candle is related to the strength of the move. The calculations for this are: cumulative sum of +volume if open < close OR -volume if open > close. I have added percentile bands so you know where the neutral zones and strong zones are. Interestingly you can also see what the volume is doing by watching where the neutral zone is. If the volume is in the red or green it is a strong move. This is standardized to make it more useful. Now you can see where the exhaustion points are on the short term. Dont forget you can change the settings and you wont die. Thank you for your interest in this release I hope you find great piles of money with it.
リリースノート
I added an option for obv calculations instead of cumulative volumeリリースノート
changed the name lolオープンソーススクリプト
TradingViewの精神に則り、このスクリプトの作者はコードをオープンソースとして公開してくれました。トレーダーが内容を確認・検証できるようにという配慮です。作者に拍手を送りましょう!無料で利用できますが、コードの再公開はハウスルールに従う必要があります。
免責事項
この情報および投稿は、TradingViewが提供または推奨する金融、投資、トレード、その他のアドバイスや推奨を意図するものではなく、それらを構成するものでもありません。詳細は利用規約をご覧ください。
オープンソーススクリプト
TradingViewの精神に則り、このスクリプトの作者はコードをオープンソースとして公開してくれました。トレーダーが内容を確認・検証できるようにという配慮です。作者に拍手を送りましょう!無料で利用できますが、コードの再公開はハウスルールに従う必要があります。
免責事項
この情報および投稿は、TradingViewが提供または推奨する金融、投資、トレード、その他のアドバイスや推奨を意図するものではなく、それらを構成するものでもありません。詳細は利用規約をご覧ください。