OPEN-SOURCE SCRIPT
FDL Horizontal Levels + EMAs (US30 & YM1)
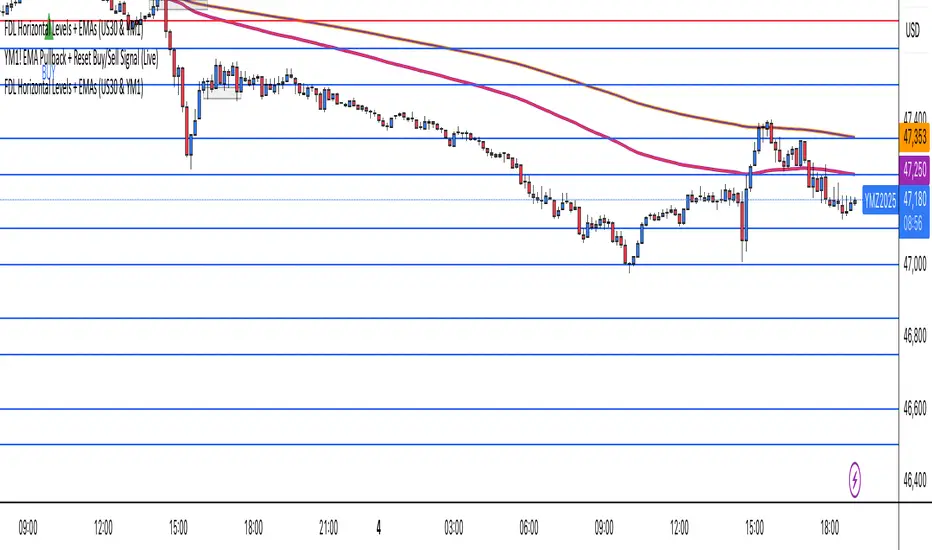
This indicator automatically plots institutional horizontal levels for US30 and YM1, so you don’t have to mark them manually. It also shows the 100 EMA and 200 EMA on all timeframes.
Horizontal levels are displayed on 3, 5, 10, 15, and 30-minute charts.
Horizontal levels are displayed on 3, 5, 10, 15, and 30-minute charts.
オープンソーススクリプト
TradingViewの精神に則り、この作者はスクリプトのソースコードを公開しているので、その内容を理解し検証することができます。作者に感謝です!無料でお使いいただけますが、このコードを投稿に再利用する際にはハウスルールに従うものとします。
免責事項
これらの情報および投稿は、TradingViewが提供または保証する金融、投資、取引、またはその他の種類のアドバイスや推奨を意図したものではなく、またそのようなものでもありません。詳しくは利用規約をご覧ください。
オープンソーススクリプト
TradingViewの精神に則り、この作者はスクリプトのソースコードを公開しているので、その内容を理解し検証することができます。作者に感謝です!無料でお使いいただけますが、このコードを投稿に再利用する際にはハウスルールに従うものとします。
免責事項
これらの情報および投稿は、TradingViewが提供または保証する金融、投資、取引、またはその他の種類のアドバイスや推奨を意図したものではなく、またそのようなものでもありません。詳しくは利用規約をご覧ください。