OPEN-SOURCE SCRIPT
Stocks Advance/Decline Histogram
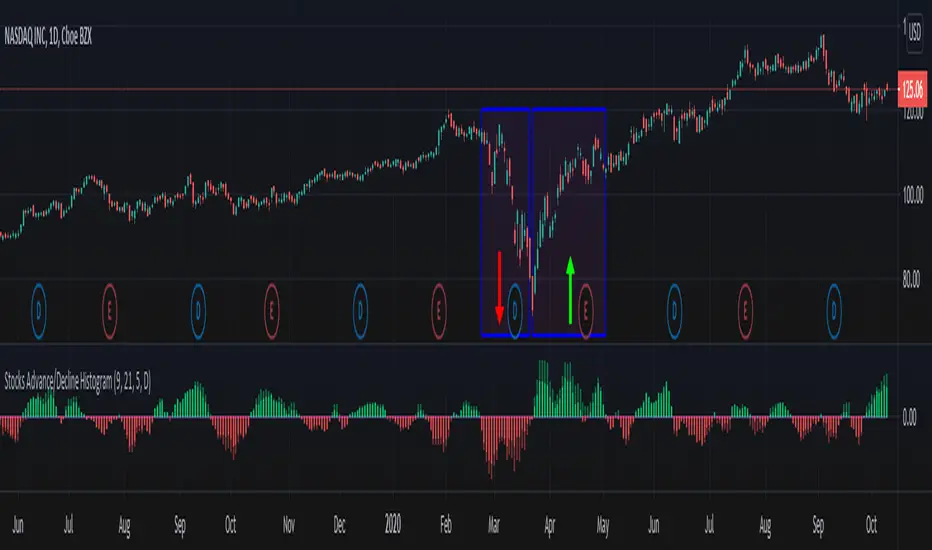
Stocks Advance/Decline Histogram indicator, which I call ADH is my own implementation that plots an histogram of the difference between the number of advancing and declining stocks on a daily basis (or higher time frame) for the NASDAQ and NYSE.
How to use it?
Green: More NYSE stocks are advancing than declining.
Red: More NYSE stocks are declining than advancing.
Light Green: More NASDAQ stocks are advancing than declining.
Light Red: More NASDAQ stocks are declining than advancing.
Note: Advance/Decline data is based on daily or higher time frames.
オープンソーススクリプト
TradingViewの精神に則り、このスクリプトの作者はコードをオープンソースとして公開してくれました。トレーダーが内容を確認・検証できるようにという配慮です。作者に拍手を送りましょう!無料で利用できますが、コードの再公開はハウスルールに従う必要があります。
Appreciation of my work: paypal.me/dman103
All Premium indicators: algo.win
LIVE Stream - Pivot Points Algo: youtube.com/channel/UCFyqab-i0xb2jf-c18ufH0A/live
All Premium indicators: algo.win
LIVE Stream - Pivot Points Algo: youtube.com/channel/UCFyqab-i0xb2jf-c18ufH0A/live
免責事項
この情報および投稿は、TradingViewが提供または推奨する金融、投資、トレード、その他のアドバイスや推奨を意図するものではなく、それらを構成するものでもありません。詳細は利用規約をご覧ください。