OPEN-SOURCE SCRIPT
US Fed Rate Cut Historical Dates
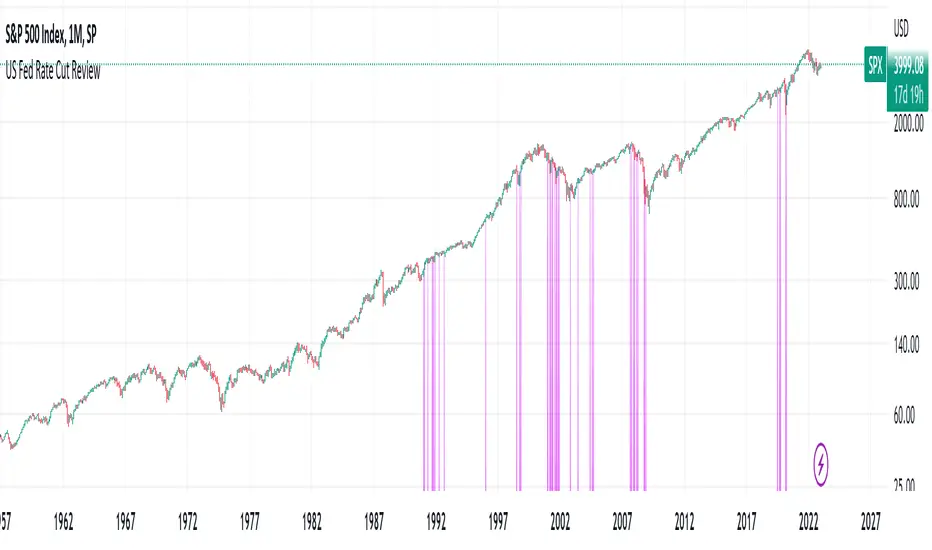
The script applies Purple (color can be changed) highlights to the days that the US Federal Reserve Cut interest rates. Data goes back to the 60's. This can be applied to any chart/timeframe to view how the asset behaved before/during/after Federal Rate cuts.
****This was updated as of Dec 2022... Any decisions after Dec 2022 will not show up in this indicator.
Versions may be updated periodically to include new data.
Hope this helps. Happy Trades
-SnarkyPuppy
****This was updated as of Dec 2022... Any decisions after Dec 2022 will not show up in this indicator.
Versions may be updated periodically to include new data.
Hope this helps. Happy Trades
-SnarkyPuppy
オープンソーススクリプト
TradingViewの精神に則り、このスクリプトの作者はコードをオープンソースとして公開してくれました。トレーダーが内容を確認・検証できるようにという配慮です。作者に拍手を送りましょう!無料で利用できますが、コードの再公開はハウスルールに従う必要があります。
免責事項
この情報および投稿は、TradingViewが提供または推奨する金融、投資、トレード、その他のアドバイスや推奨を意図するものではなく、それらを構成するものでもありません。詳細は利用規約をご覧ください。
オープンソーススクリプト
TradingViewの精神に則り、このスクリプトの作者はコードをオープンソースとして公開してくれました。トレーダーが内容を確認・検証できるようにという配慮です。作者に拍手を送りましょう!無料で利用できますが、コードの再公開はハウスルールに従う必要があります。
免責事項
この情報および投稿は、TradingViewが提供または推奨する金融、投資、トレード、その他のアドバイスや推奨を意図するものではなく、それらを構成するものでもありません。詳細は利用規約をご覧ください。