OPEN-SOURCE SCRIPT
更新済 Price Data Label
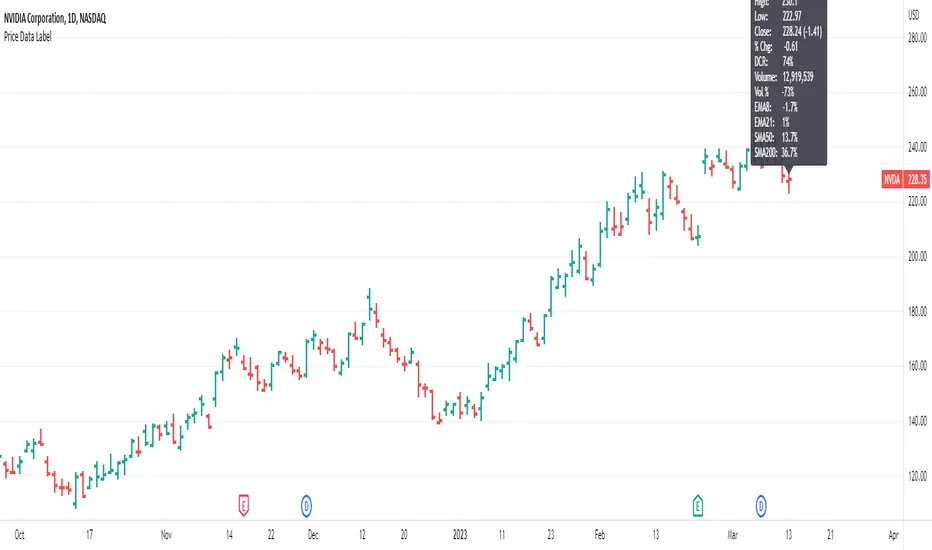
This indicator gives you the ability to see historical data for each bar on the chart by simply hovering over the high of the bar, similar to the functionality of MarketSmith.
Data for each bar includes:
Example of stats on a historical bar:

* Note this only works on the last 500 historical bars. If you use bar replay it will work with 500 historical bars from the last bar.
* If you have multiple indicators on your chart, in order to see the data you will need to use visual order to bring to front. This can be done by clicking the three dots next to the indicator name and selecting visual order.

Data for each bar includes:
- Open
- High
- Low
- Close + Change
- Percentage Change
- Closing Range
- Volume
- Volume Percent based on 50 day average
- Distance to 4 selectable moving averages
Example of stats on a historical bar:
* Note this only works on the last 500 historical bars. If you use bar replay it will work with 500 historical bars from the last bar.
* If you have multiple indicators on your chart, in order to see the data you will need to use visual order to bring to front. This can be done by clicking the three dots next to the indicator name and selecting visual order.
リリースノート
Turned off the label always showing that was needed for picture. リリースノート
Added moving average values to the labelリリースノート
Update to show index volume for the Nasdaq and SPX as well as calculate the index volume percent change vs 50 day average volume. リリースノート
Update now allows for selectable weekly moving averages. The label will automatically adjust to the user selected weekly moving averages when looking at a weekly chart. リリースノート
Volume % calculation is now based on the run rate to show the projected volume finish compared to the average volume. リリースノート
Added a new required parameter to the time format function in the code.リリースノート
option to view % as ATRオープンソーススクリプト
TradingViewの精神に則り、このスクリプトの作者はコードをオープンソースとして公開してくれました。トレーダーが内容を確認・検証できるようにという配慮です。作者に拍手を送りましょう!無料で利用できますが、コードの再公開はハウスルールに従う必要があります。
Trusted Pine programmer. Send me a message for script development.
免責事項
この情報および投稿は、TradingViewが提供または推奨する金融、投資、トレード、その他のアドバイスや推奨を意図するものではなく、それらを構成するものでもありません。詳細は利用規約をご覧ください。
オープンソーススクリプト
TradingViewの精神に則り、このスクリプトの作者はコードをオープンソースとして公開してくれました。トレーダーが内容を確認・検証できるようにという配慮です。作者に拍手を送りましょう!無料で利用できますが、コードの再公開はハウスルールに従う必要があります。
Trusted Pine programmer. Send me a message for script development.
免責事項
この情報および投稿は、TradingViewが提供または推奨する金融、投資、トレード、その他のアドバイスや推奨を意図するものではなく、それらを構成するものでもありません。詳細は利用規約をご覧ください。