OPEN-SOURCE SCRIPT
Candle-Based Negative Space (Improved)
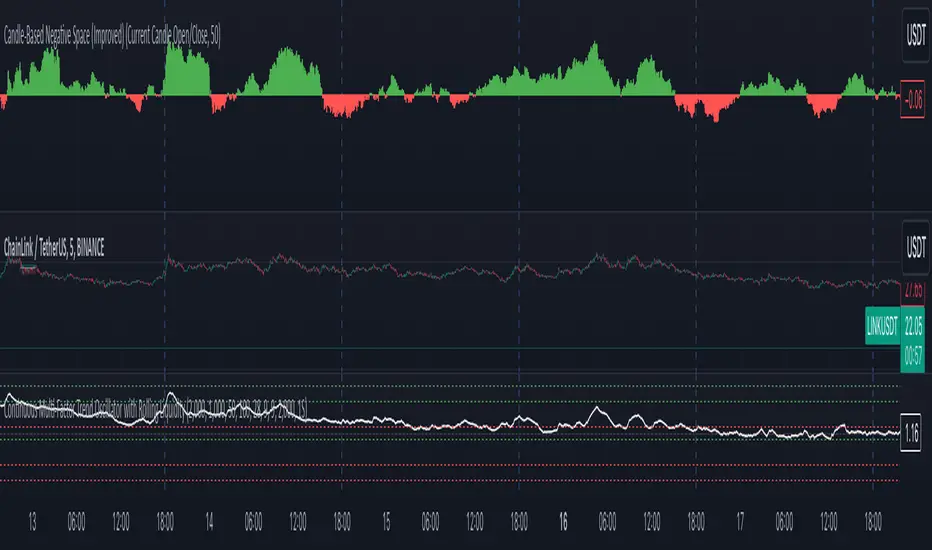
This script visualizes the concept of negative space (when a candle closes below a defined baseline) and positive space (when a candle closes above the baseline) on a price chart. It uses user-defined inputs to configure the baseline and optionally includes a moving average for additional trend analysis. Below is a detailed explanation of the script and suggestions for improving its plotting.
Explanation of the Script
Purpose
The script helps traders visualize the relationship between price movements and a dynamically chosen baseline. The baseline can be based on:
The high/low of the previous candle.
The open/close of the current candle.
The "negative space" is calculated when the closing price is below the baseline, and the "positive space" is calculated when the closing price is above the baseline. The sum of these spaces over a period is plotted as a histogram to provide insights into market strength.
オープンソーススクリプト
TradingViewの精神に則り、このスクリプトの作者はコードをオープンソースとして公開してくれました。トレーダーが内容を確認・検証できるようにという配慮です。作者に拍手を送りましょう!無料で利用できますが、コードの再公開はハウスルールに従う必要があります。
免責事項
この情報および投稿は、TradingViewが提供または推奨する金融、投資、トレード、その他のアドバイスや推奨を意図するものではなく、それらを構成するものでもありません。詳細は利用規約をご覧ください。
オープンソーススクリプト
TradingViewの精神に則り、このスクリプトの作者はコードをオープンソースとして公開してくれました。トレーダーが内容を確認・検証できるようにという配慮です。作者に拍手を送りましょう!無料で利用できますが、コードの再公開はハウスルールに従う必要があります。
免責事項
この情報および投稿は、TradingViewが提供または推奨する金融、投資、トレード、その他のアドバイスや推奨を意図するものではなく、それらを構成するものでもありません。詳細は利用規約をご覧ください。