OPEN-SOURCE SCRIPT
Elliott Wave Auto Detector (Simplified)
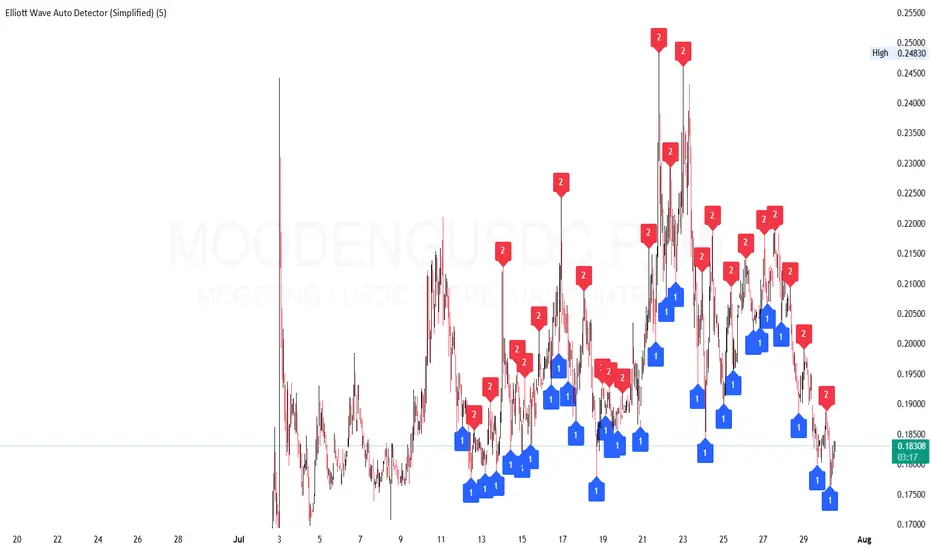
How to Use the Detector
Identify Structure: Look for sequences like 1-2-1-2...
These may show a forming or ongoing Elliott wave pattern.
Validate Trend: Multiple red 2’s at lower highs suggests a bearish trend; the reverse with blue 1’s at higher lows is bullish.
Trading Zones:
Consider buying near clusters of blue 1’s (support zones).
Consider selling or shorting near clusters of red 2’s (resistance zones).
Look for Breakouts: If price breaks out of the descending channel, trend may reverse or accelerate.
オープンソーススクリプト
TradingViewの精神に則り、このスクリプトの作者はコードをオープンソースとして公開してくれました。トレーダーが内容を確認・検証できるようにという配慮です。作者に拍手を送りましょう!無料で利用できますが、コードの再公開はハウスルールに従う必要があります。
免責事項
この情報および投稿は、TradingViewが提供または推奨する金融、投資、トレード、その他のアドバイスや推奨を意図するものではなく、それらを構成するものでもありません。詳細は利用規約をご覧ください。
オープンソーススクリプト
TradingViewの精神に則り、このスクリプトの作者はコードをオープンソースとして公開してくれました。トレーダーが内容を確認・検証できるようにという配慮です。作者に拍手を送りましょう!無料で利用できますが、コードの再公開はハウスルールに従う必要があります。
免責事項
この情報および投稿は、TradingViewが提供または推奨する金融、投資、トレード、その他のアドバイスや推奨を意図するものではなく、それらを構成するものでもありません。詳細は利用規約をご覧ください。