OPEN-SOURCE SCRIPT
更新済 Volume Price Balance by serkany88
This idea has been in my mind for a while. We all know how important volume is to technical analysis but volume and price itself doesn't mean much when volatility and momentum of the current trend is not taken into account. With this oscillator we try to combine all these factors into one indicator and provide a simplified interpretation of this relationship with spread analysis. This indicator can be used in all timeframes but higher timeframes like 1 hour and above will provide most stable results.
How it works?
This oscillator tries to analyze volume spread along with price spread based on wyckoff methods and attains certain "strength value" for each candle and it's relationship with the volume. After this calculation preferably we remove detected rejection candles from overall calculation and draw them as plots. The multipliers of the strengths can be changed from the settings.
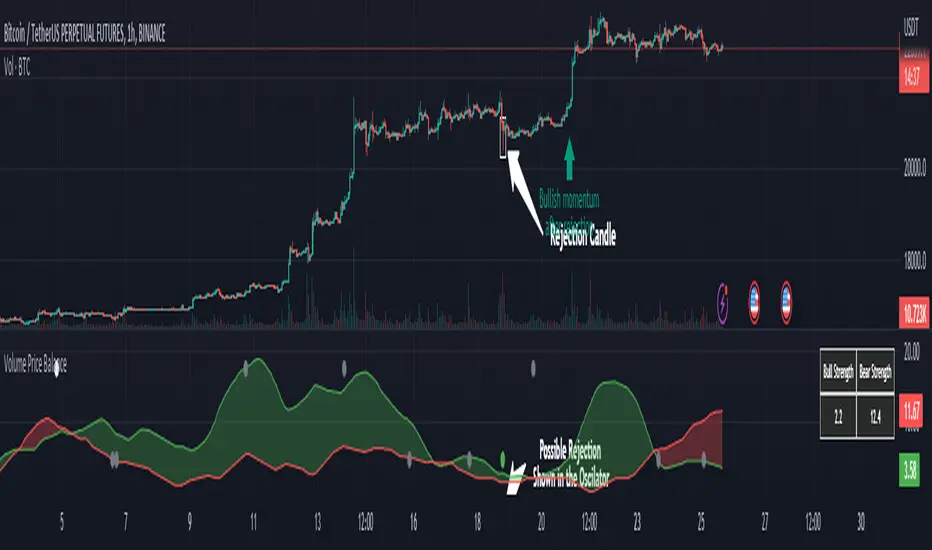
Let's check the example below

As you can see we see a green dot appear in a somewhat weakening bullish momentum, this can mean possible reversal can happen soon and it does.
Below is a bearish example

In this example we see a possible strong reversal signal in a increasing bullish momentum and the price reacts immediately after the candle.
We also have a table that shows the current non-smoothed result of trend strength based on calculated price-volume spread at top right of the oscillator.
How it works?
This oscillator tries to analyze volume spread along with price spread based on wyckoff methods and attains certain "strength value" for each candle and it's relationship with the volume. After this calculation preferably we remove detected rejection candles from overall calculation and draw them as plots. The multipliers of the strengths can be changed from the settings.
- Green Line Above Red Line = Bullish momentum stronger
- Red Line Above Green Line = Bearish momentum stronger
- Top circles mean possible bullish reversal candle detected. Gray is weak, White is normal and Red top circle means strong possible reversal detected.
- Bottom circles mean possible bearish reversal candle detected. Gray is weak, White is normal and Green bottom circle means strong possible reversal detected.
Let's check the example below
As you can see we see a green dot appear in a somewhat weakening bullish momentum, this can mean possible reversal can happen soon and it does.
Below is a bearish example
In this example we see a possible strong reversal signal in a increasing bullish momentum and the price reacts immediately after the candle.
We also have a table that shows the current non-smoothed result of trend strength based on calculated price-volume spread at top right of the oscillator.
リリースノート
Added alerts for single or all rejections.オープンソーススクリプト
TradingViewの精神に則り、このスクリプトの作者はコードをオープンソースとして公開してくれました。トレーダーが内容を確認・検証できるようにという配慮です。作者に拍手を送りましょう!無料で利用できますが、コードの再公開はハウスルールに従う必要があります。
One does not simply win every trade.
免責事項
この情報および投稿は、TradingViewが提供または推奨する金融、投資、トレード、その他のアドバイスや推奨を意図するものではなく、それらを構成するものでもありません。詳細は利用規約をご覧ください。
オープンソーススクリプト
TradingViewの精神に則り、このスクリプトの作者はコードをオープンソースとして公開してくれました。トレーダーが内容を確認・検証できるようにという配慮です。作者に拍手を送りましょう!無料で利用できますが、コードの再公開はハウスルールに従う必要があります。
One does not simply win every trade.
免責事項
この情報および投稿は、TradingViewが提供または推奨する金融、投資、トレード、その他のアドバイスや推奨を意図するものではなく、それらを構成するものでもありません。詳細は利用規約をご覧ください。