OPEN-SOURCE SCRIPT
更新済 VWMA : 20 50 200
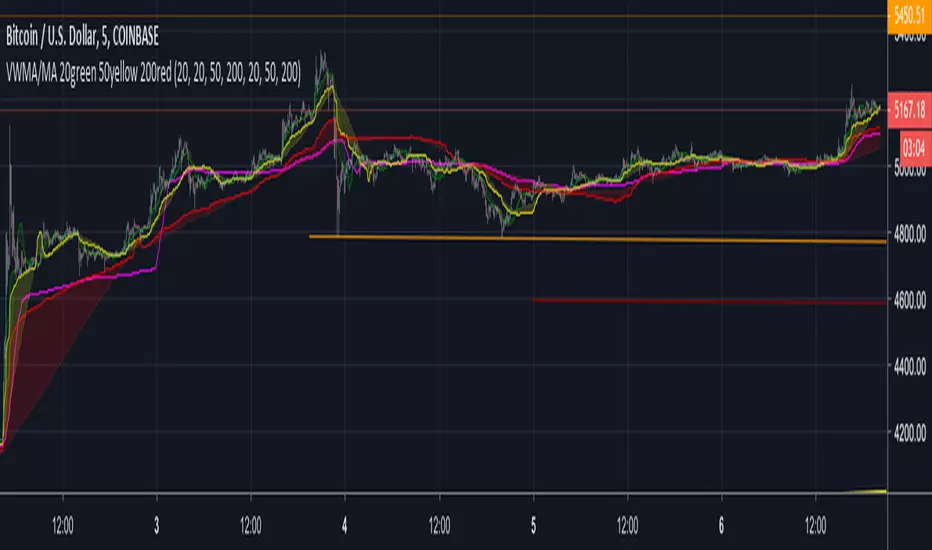
Plots 20, 50 and 200 tick Volume Weighted MA and Simple MA.
The Volume Weighted MA tends to move before the SMA. I am seeing significant price movements on crypto charts near 50 VWMA crosses. As well, the 20-50 VWMA crosses. When the thicker lines ( VWMA ) are above or below the same color SMA, this divergence can also signal changes in trends.
This is my first script and likely be updated. Feedback is welcome.
リリースノート
This update shades the areas between the relative VWMA and SMA. When the related averages cross, or the expansion / contraction can be good indicators of changing trends.リリースノート
Trying to add new features, I worked on using the built in vwap variable to create a 20 tick ma for it- purple line.Script was rewritten in places but charting is same.
オープンソーススクリプト
TradingViewの精神に則り、このスクリプトの作者はコードをオープンソースとして公開してくれました。トレーダーが内容を確認・検証できるようにという配慮です。作者に拍手を送りましょう!無料で利用できますが、コードの再公開はハウスルールに従う必要があります。
免責事項
この情報および投稿は、TradingViewが提供または推奨する金融、投資、トレード、その他のアドバイスや推奨を意図するものではなく、それらを構成するものでもありません。詳細は利用規約をご覧ください。
オープンソーススクリプト
TradingViewの精神に則り、このスクリプトの作者はコードをオープンソースとして公開してくれました。トレーダーが内容を確認・検証できるようにという配慮です。作者に拍手を送りましょう!無料で利用できますが、コードの再公開はハウスルールに従う必要があります。
免責事項
この情報および投稿は、TradingViewが提供または推奨する金融、投資、トレード、その他のアドバイスや推奨を意図するものではなく、それらを構成するものでもありません。詳細は利用規約をご覧ください。