OPEN-SOURCE SCRIPT
更新済 Round Numbers (Plotter) v2
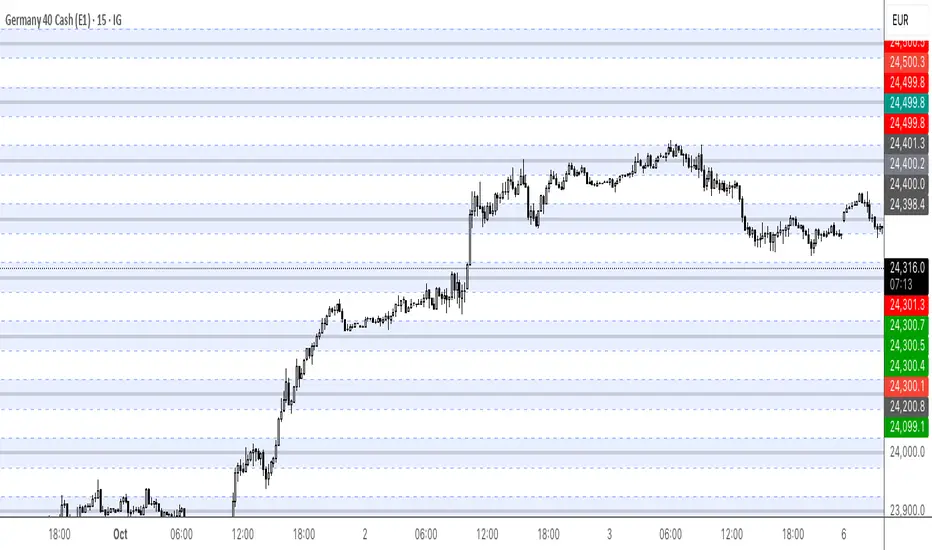
The *Round Numbers (Plotter) v2* indicator highlights key psychological price levels on the chart — the so-called *round numbers* (e.g. 1.1000 on EURUSD or23,000 on NASDAQ).
These levels often act as **natural support or resistance zones**, where price tends to react, consolidate, or reverse.
Version 2 introduces the concept of **gravitational zones**, which define a price range surrounding each round level — visualizing how price “gravitates” around these equilibrium areas.
---
### 🧩 **Main Features**
* 🔹 **Dynamic round levels:** plotted automatically based on user-defined *step size* (in points or pips).
* 🔹 **Custom step mode:** switch between “Points” (for indices, commodities, crypto) and “Pips” (for Forex pairs).
* 🔹 **Configurable appearance:** color, width, and line style (solid, dashed, dotted).
* 🔹 **Gravitation zones:** optional secondary lines plotted above and below each round level.
* Distance adjustable as a **percentage of the step size** (default = 25%).
* Help visualize “magnet areas” where price tends to slow down or oscillate before crossing a level.
* 🔹 **Optional fill:** softly shaded area between the upper and lower gravitation lines for clearer visualization of each zone.
* You can enable or disable this with the *“Show gravitation fill”* toggle.
* Fill color and transparency fully customizable.
---
### 📈 **Use Cases**
* Identify **psychological support/resistance** levels on any instrument or timeframe.
* Observe **market equilibrium zones** where price tends to cluster or hesitate before continuing.
* Combine with oscillators or volume indicators to confirm reaction strength near round numbers.
* Use the **gravitational zones** to refine stop-loss or take-profit placement near high-impact levels.
---
### 💡 **Notes**
* The indicator does **not repaint** and updates levels dynamically based on the latest price.
* Works on all asset classes: **Forex, Indices, Crypto, Commodities, Stocks.**
* Designed to be **lightweight** — no accumulation of historical objects.
* Combine this with *Round Number Analyzer* for complete analysis of round numbers level
リリースノート
The Round Numbers (Plotter) v2 indicator highlights key psychological price levels on the chart — the so-called *round numbers* (e.g. 1.1000 on EURUSD or23,000 on NASDAQ).These levels often act as **natural support or resistance zones**, where price tends to react, consolidate, or reverse.
Version 2 introduces the concept of **gravitational zones**, which define a price range surrounding each round level — visualizing how price “gravitates” around these equilibrium areas.
---
### 🧩 **Main Features**
* 🔹 **Dynamic round levels:** plotted automatically based on user-defined *step size* (in points or pips).
* 🔹 **Custom step mode:** switch between “Points” (for indices, commodities, crypto) and “Pips” (for Forex pairs).
* 🔹 **Configurable appearance:** color, width, and line style (solid, dashed, dotted).
* 🔹 **Gravitation zones:** optional secondary lines plotted above and below each round level.
* Distance adjustable as a **percentage of the step size** (default = 25%).
* Help visualize “magnet areas” where price tends to slow down or oscillate before crossing a level.
* 🔹 **Optional fill:** softly shaded area between the upper and lower gravitation lines for clearer visualization of each zone.
* You can enable or disable this with the *“Show gravitation fill”* toggle.
* Fill color and transparency fully customizable.
---
### 📈 **Use Cases**
* Identify **psychological support/resistance** levels on any instrument or timeframe.
* Observe **market equilibrium zones** where price tends to cluster or hesitate before continuing.
* Combine with oscillators or volume indicators to confirm reaction strength near round numbers.
* Use the **gravitational zones** to refine stop-loss or take-profit placement near high-impact levels.
---
### 💡 **Notes**
* The indicator does **not repaint** and updates levels dynamically based on the latest price.
* Works on all asset classes: **Forex, Indices, Crypto, Commodities, Stocks.**
* Designed to be **lightweight** — no accumulation of historical objects.
* Combine this with *Round Number Analyzer* for complete analysis of round numbers level
オープンソーススクリプト
TradingViewの精神に則り、このスクリプトの作者はコードをオープンソースとして公開してくれました。トレーダーが内容を確認・検証できるようにという配慮です。作者に拍手を送りましょう!無料で利用できますが、コードの再公開はハウスルールに従う必要があります。
免責事項
この情報および投稿は、TradingViewが提供または推奨する金融、投資、トレード、その他のアドバイスや推奨を意図するものではなく、それらを構成するものでもありません。詳細は利用規約をご覧ください。
オープンソーススクリプト
TradingViewの精神に則り、このスクリプトの作者はコードをオープンソースとして公開してくれました。トレーダーが内容を確認・検証できるようにという配慮です。作者に拍手を送りましょう!無料で利用できますが、コードの再公開はハウスルールに従う必要があります。
免責事項
この情報および投稿は、TradingViewが提供または推奨する金融、投資、トレード、その他のアドバイスや推奨を意図するものではなく、それらを構成するものでもありません。詳細は利用規約をご覧ください。