OPEN-SOURCE SCRIPT
AZ Column Color
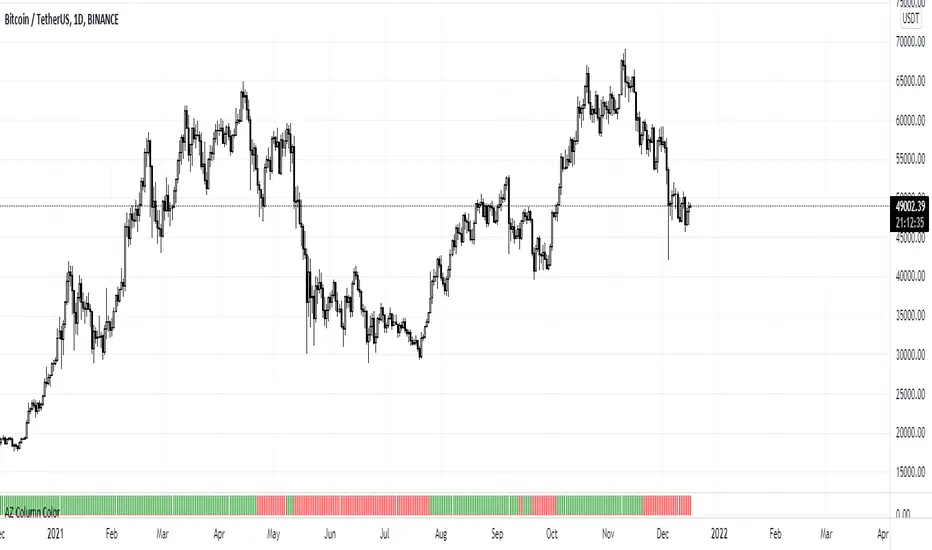
This indicator is based on ema cross-over (12,26).
In Thailand, the ema 12,26 Cross over is well known as the CDC-ACTION ZONE indicator.
.
The definition of a bullish trend in this indicator is when the fast ema crosses up the slow ema .
The definition of a bearish trend is when the fast ema crosses down the slow ema .
.
When fast ema is over slow ema the column will show in a green column and when fast ema is below slow ema the column will show in a red column.
.
I have made this indicator for use with CDC-ACTION ZONE.
オープンソーススクリプト
TradingViewの精神に則り、このスクリプトの作者はコードをオープンソースとして公開してくれました。トレーダーが内容を確認・検証できるようにという配慮です。作者に拍手を送りましょう!無料で利用できますが、コードの再公開はハウスルールに従う必要があります。
免責事項
この情報および投稿は、TradingViewが提供または推奨する金融、投資、トレード、その他のアドバイスや推奨を意図するものではなく、それらを構成するものでもありません。詳細は利用規約をご覧ください。
オープンソーススクリプト
TradingViewの精神に則り、このスクリプトの作者はコードをオープンソースとして公開してくれました。トレーダーが内容を確認・検証できるようにという配慮です。作者に拍手を送りましょう!無料で利用できますが、コードの再公開はハウスルールに従う必要があります。
免責事項
この情報および投稿は、TradingViewが提供または推奨する金融、投資、トレード、その他のアドバイスや推奨を意図するものではなく、それらを構成するものでもありません。詳細は利用規約をご覧ください。