OPEN-SOURCE SCRIPT
Vertical Line on Custom Date
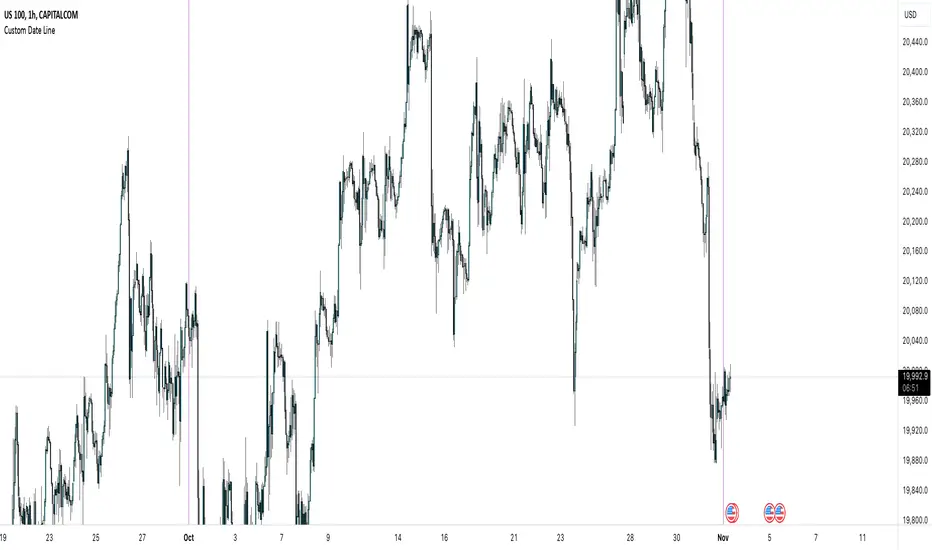
This Pine Script code creates a custom indicator for TradingView that draws a vertical line on the chart at a specific date and time defined by the user.
User Input: Allows the user to specify the day, hour, and minute when the vertical line should appear.
Vertical Line Drawing: When the current date and time match the user’s inputs, a vertical line is drawn on the chart at the corresponding bar, offset by one bar to align properly.
Customizable Color and Width: The vertical line is displayed in purple with a customizable width.
Overall, this indicator helps traders visually mark important dates and times on their price charts.
オープンソーススクリプト
TradingViewの精神に則り、このスクリプトの作者はコードをオープンソースとして公開してくれました。トレーダーが内容を確認・検証できるようにという配慮です。作者に拍手を送りましょう!無料で利用できますが、コードの再公開はハウスルールに従う必要があります。
免責事項
この情報および投稿は、TradingViewが提供または推奨する金融、投資、トレード、その他のアドバイスや推奨を意図するものではなく、それらを構成するものでもありません。詳細は利用規約をご覧ください。
オープンソーススクリプト
TradingViewの精神に則り、このスクリプトの作者はコードをオープンソースとして公開してくれました。トレーダーが内容を確認・検証できるようにという配慮です。作者に拍手を送りましょう!無料で利用できますが、コードの再公開はハウスルールに従う必要があります。
免責事項
この情報および投稿は、TradingViewが提供または推奨する金融、投資、トレード、その他のアドバイスや推奨を意図するものではなく、それらを構成するものでもありません。詳細は利用規約をご覧ください。