OPEN-SOURCE SCRIPT
Real-Time Price Line by Candle Color
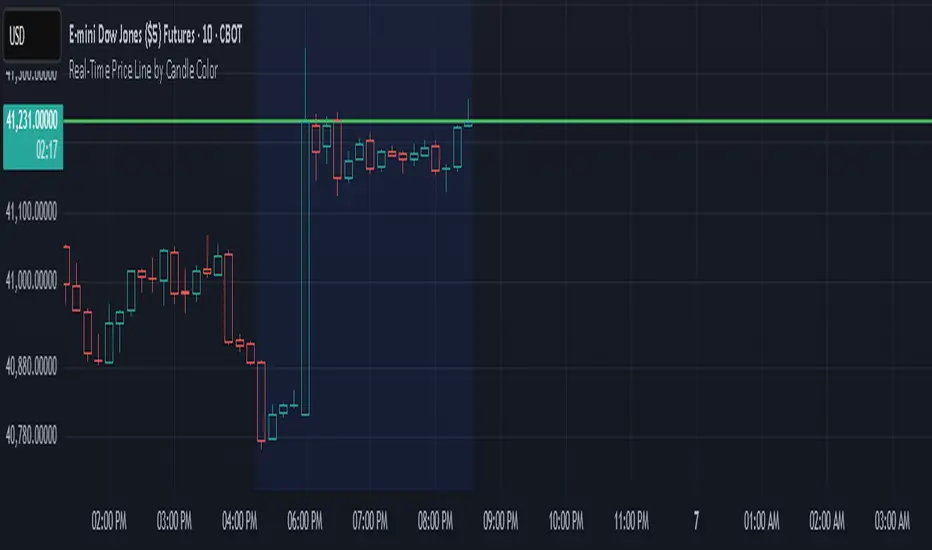
This indicator draws a horizontal line at the current price that updates in real time on each candle. The line:
Extends infinitely left and right
Changes color based on the current candle:
🟢 Green if the candle is bullish (close ≥ open)
🔴 Red if the candle is bearish (close < open)
Automatically clears and redraws each bar to reflect the latest price and direction
Use this as a simple but effective visual aid to track the live price and its directional bias.
オープンソーススクリプト
TradingViewの精神に則り、このスクリプトの作者はコードをオープンソースとして公開してくれました。トレーダーが内容を確認・検証できるようにという配慮です。作者に拍手を送りましょう!無料で利用できますが、コードの再公開はハウスルールに従う必要があります。
免責事項
この情報および投稿は、TradingViewが提供または推奨する金融、投資、トレード、その他のアドバイスや推奨を意図するものではなく、それらを構成するものでもありません。詳細は利用規約をご覧ください。
オープンソーススクリプト
TradingViewの精神に則り、このスクリプトの作者はコードをオープンソースとして公開してくれました。トレーダーが内容を確認・検証できるようにという配慮です。作者に拍手を送りましょう!無料で利用できますが、コードの再公開はハウスルールに従う必要があります。
免責事項
この情報および投稿は、TradingViewが提供または推奨する金融、投資、トレード、その他のアドバイスや推奨を意図するものではなく、それらを構成するものでもありません。詳細は利用規約をご覧ください。