OPEN-SOURCE SCRIPT
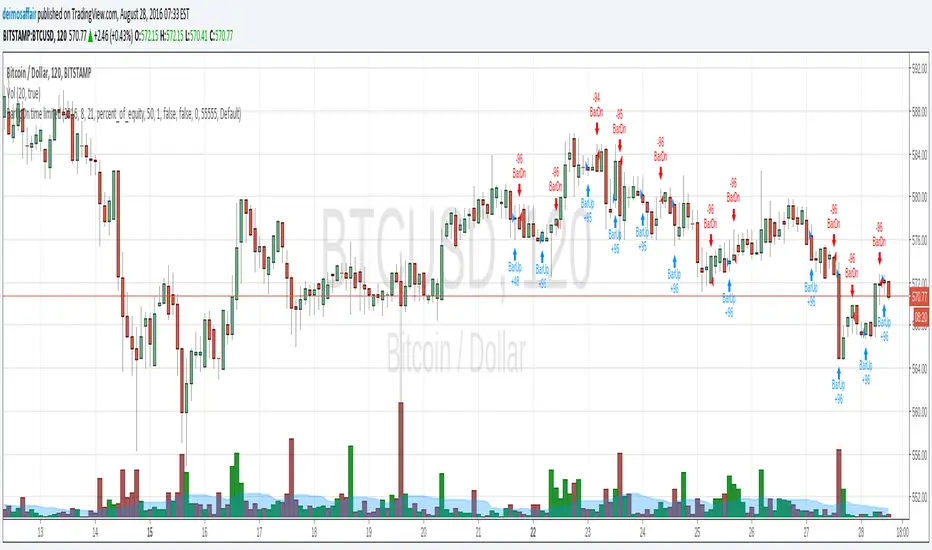
BarUpDn time limited
trying to understand strategies, it appears that there is a lot of black magic in how a strat works behind the scenes.
anyway, it's hard to analyse what's all the data with one gazillion entries, and i wanted to know how we can manipulate/do stuff with a chart.
so, i needed to know how to "give" the script my values to work on. bundled two wants/needs into one, and created a script that only applies a strategy from the date given onwards.
how to use:
at the chart, go to the "format" little button, then the input tab, and there is all the date fields i created. fun to set it to the current date, then start going backwards and see all the little arrows filing up the chart :)
オープンソーススクリプト
TradingViewの精神に則り、このスクリプトの作者はコードをオープンソースとして公開してくれました。トレーダーが内容を確認・検証できるようにという配慮です。作者に拍手を送りましょう!無料で利用できますが、コードの再公開はハウスルールに従う必要があります。
免責事項
この情報および投稿は、TradingViewが提供または推奨する金融、投資、トレード、その他のアドバイスや推奨を意図するものではなく、それらを構成するものでもありません。詳細は利用規約をご覧ください。
オープンソーススクリプト
TradingViewの精神に則り、このスクリプトの作者はコードをオープンソースとして公開してくれました。トレーダーが内容を確認・検証できるようにという配慮です。作者に拍手を送りましょう!無料で利用できますが、コードの再公開はハウスルールに従う必要があります。
免責事項
この情報および投稿は、TradingViewが提供または推奨する金融、投資、トレード、その他のアドバイスや推奨を意図するものではなく、それらを構成するものでもありません。詳細は利用規約をご覧ください。