OPEN-SOURCE SCRIPT
更新済 MACDV
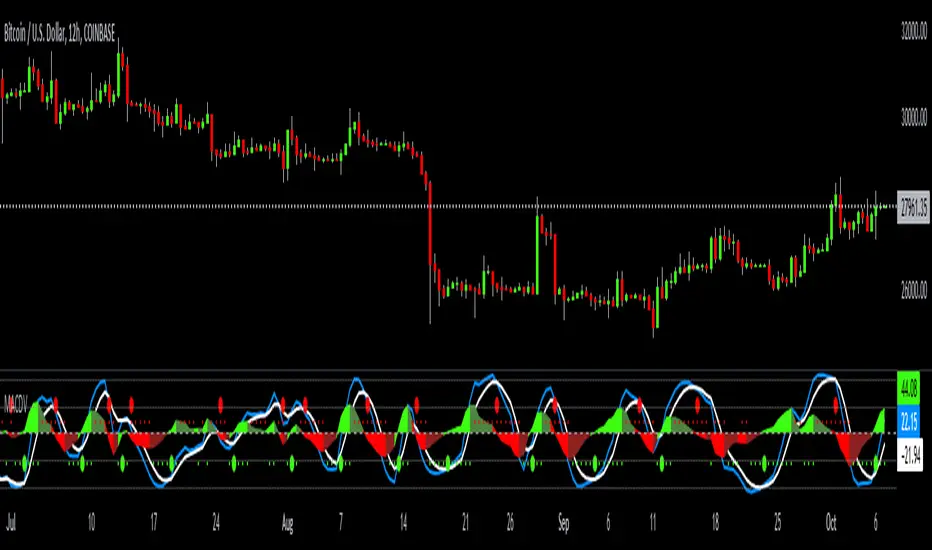
MACDV = Moving Average Convergence Divergence Volume
The MACDV indicator uses stochastic accumulation / distribution volume inflow and outflow formulas to visualize it in a standard MACD type of appearance.
To be able to merge these formulas I had to normalize the math.
Accumulation / distribution volume is a unique scale.
Stochastic is a 0-100 scale.
MACD is a unique scale.
The normalized output scale range for MACDV is -100 to 100.
100 = overbought
-100 = oversold
Everything in between is either bullish or bearish.
Rising = bullish
Falling = bearish
crossover = bullish
crossunder = bearish
convergence = direction change
divergence = momentum
The default input settings are:
7 = K length, Stochastic accumulation / distribution length
3 = D smoothing, smoothing stochastic accumulation / distribution volume weighted moving average
6 = MACDV fast, MACDV fast length line
color = blue
13 = MACDV slow, MACDV slow length line
color = white
4 = MACDV signal, MACDV histogram length
color rising above 0 = bright green
color falling above 0 = dark green
color falling below 0 = bright red
color rising below 0 = dark red
2 = Stretch, Output multiplier for MACDV visual expansion
Horizontal lines:
100
75
50
25
0
-25
-50
-75
-100
リリースノート
add cross options:bullish macdLine crossover signalLine = green tiny circle
bearish macdLine crossunder signalLine = red tiny circle
リリースノート
10/7/23 update:Fine tune default input lengths.
Add a total line option.
Add a PVT or AD option.
Add a bullish or bearish tiny dot option.
リリースノート
10/14/23 update:Add 6 volume source options:
Accumulation Distribution
Price Volume Trend
Positive Volume Index
On Balance Volume
Money Flow Index
Average of all 5
オープンソーススクリプト
TradingViewの精神に則り、このスクリプトの作者はコードをオープンソースとして公開してくれました。トレーダーが内容を確認・検証できるようにという配慮です。作者に拍手を送りましょう!無料で利用できますが、コードの再公開はハウスルールに従う必要があります。
Trading indicators:
tradingview.com/u/Options360/
tradingview.com/u/Options360/
免責事項
この情報および投稿は、TradingViewが提供または推奨する金融、投資、トレード、その他のアドバイスや推奨を意図するものではなく、それらを構成するものでもありません。詳細は利用規約をご覧ください。