OPEN-SOURCE SCRIPT
BANK NIFTY list of stocks with their multi timeframe EMA trend
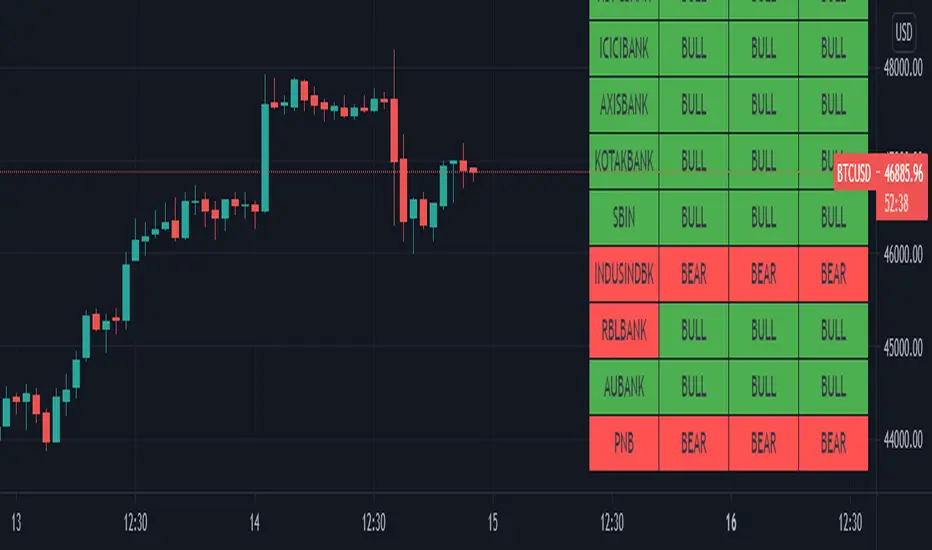
This script gives you an overview of banknifty and its underlying heavy weight stocks.
You can view the trend in single chart in 3 different time frames.
Color indication green for bullish and red for bearish trend
Symbol name shows green if the current day change is positive. Else red color
You can view the trend in single chart in 3 different time frames.
Color indication green for bullish and red for bearish trend
Symbol name shows green if the current day change is positive. Else red color
オープンソーススクリプト
TradingViewの精神に則り、このスクリプトの作者はコードをオープンソースとして公開してくれました。トレーダーが内容を確認・検証できるようにという配慮です。作者に拍手を送りましょう!無料で利用できますが、コードの再公開はハウスルールに従う必要があります。
免責事項
この情報および投稿は、TradingViewが提供または推奨する金融、投資、トレード、その他のアドバイスや推奨を意図するものではなく、それらを構成するものでもありません。詳細は利用規約をご覧ください。
オープンソーススクリプト
TradingViewの精神に則り、このスクリプトの作者はコードをオープンソースとして公開してくれました。トレーダーが内容を確認・検証できるようにという配慮です。作者に拍手を送りましょう!無料で利用できますが、コードの再公開はハウスルールに従う必要があります。
免責事項
この情報および投稿は、TradingViewが提供または推奨する金融、投資、トレード、その他のアドバイスや推奨を意図するものではなく、それらを構成するものでもありません。詳細は利用規約をご覧ください。