OPEN-SOURCE SCRIPT
更新済 RSI + MACD + EMA Buy/Sell Combo
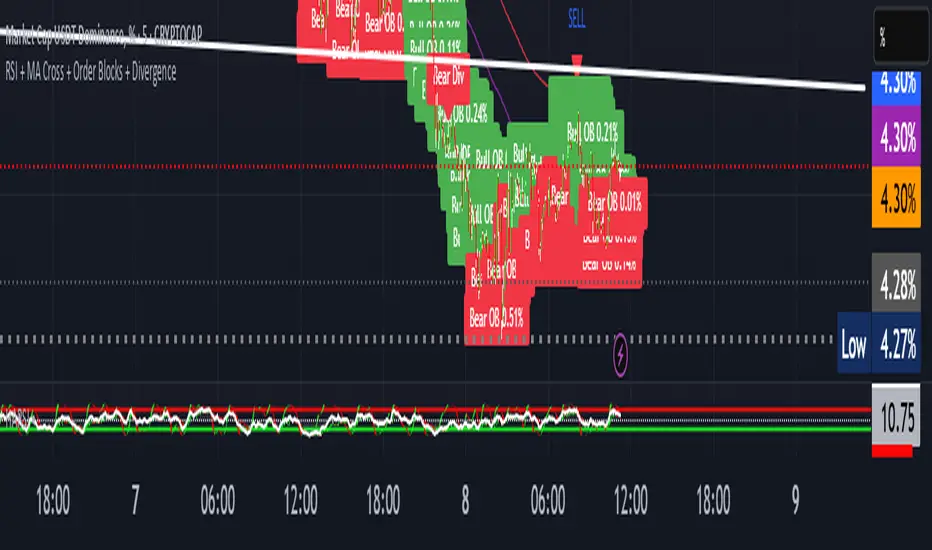
RSI + MACD + EMA Buy/Sell Combo with signals if all 2 lines up it will create buy and cell signals
リリースノート
MA 10/21/50/100/200 plotted.Golden Cross / Death Cross shown when MA50 crosses MA200.
Buy/Sell triangles shown based on RSI & MA trend.
Order Blocks:
Bull OB → Lowest low in lookback window.
Bear OB → Highest high in lookback window.
Shows strength % (price change inside the block).
Divergences: Detects simple bullish & bearish RSI divergences
オープンソーススクリプト
TradingViewの精神に則り、このスクリプトの作者はコードをオープンソースとして公開してくれました。トレーダーが内容を確認・検証できるようにという配慮です。作者に拍手を送りましょう!無料で利用できますが、コードの再公開はハウスルールに従う必要があります。
免責事項
この情報および投稿は、TradingViewが提供または推奨する金融、投資、トレード、その他のアドバイスや推奨を意図するものではなく、それらを構成するものでもありません。詳細は利用規約をご覧ください。
オープンソーススクリプト
TradingViewの精神に則り、このスクリプトの作者はコードをオープンソースとして公開してくれました。トレーダーが内容を確認・検証できるようにという配慮です。作者に拍手を送りましょう!無料で利用できますが、コードの再公開はハウスルールに従う必要があります。
免責事項
この情報および投稿は、TradingViewが提供または推奨する金融、投資、トレード、その他のアドバイスや推奨を意図するものではなく、それらを構成するものでもありません。詳細は利用規約をご覧ください。