PROTECTED SOURCE SCRIPT
QuantCat Rainbow Ribbon
QuantCat Rainbow Ribbon
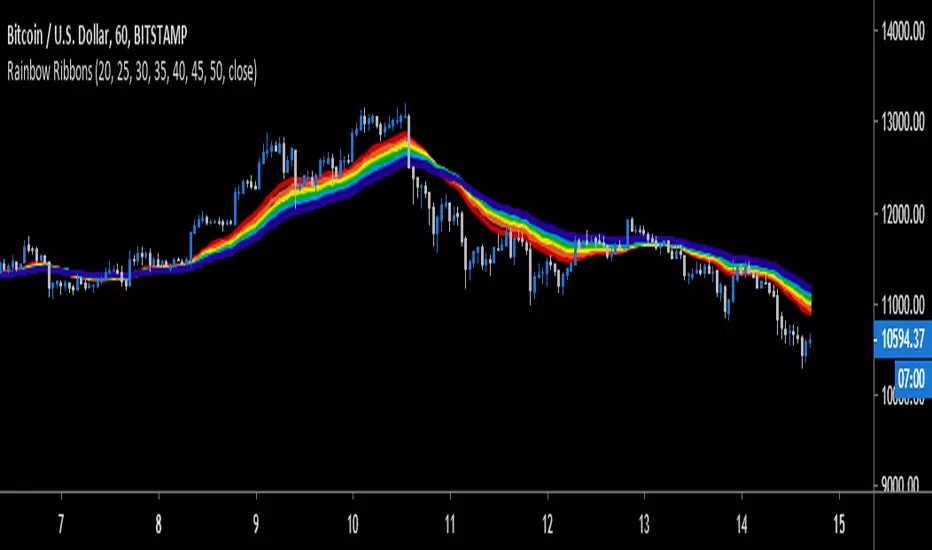
The Rainbow Ribbon is a conglomerate of exponential moving averages of increasing time period plotted on a graph. The ribbon is used to help identify the strength of a trend while also helping spot timely market reversals.
It consists of a 20, 25, 30, 35, 40, 45, and 50 EMA which are interchangeable values for your preference.
Generally in bullish conditions, the price action will be trading on top of the ribbon with the top EMA’s in the ribbon acting as support. In bearish conditions, the price action will be trading underneath the ribbon with the bottom EMA’s acting as resistance.
As shown in the chart above, when the candles penetrate the Rainbow Ribbon and the EMA’s start to converge/cross, market reversal probabilities increase. With this information we can take trades or add to the general consensus of a potential trade.
Be sure to follow us so you're kept up with our projects and any updates to the script!
保護スクリプト
このスクリプトのソースコードは非公開で投稿されています。 ただし、制限なく自由に使用できます – 詳細はこちらでご確認ください。
免責事項
この情報および投稿は、TradingViewが提供または推奨する金融、投資、トレード、その他のアドバイスや推奨を意図するものではなく、それらを構成するものでもありません。詳細は利用規約をご覧ください。
免責事項
この情報および投稿は、TradingViewが提供または推奨する金融、投資、トレード、その他のアドバイスや推奨を意図するものではなく、それらを構成するものでもありません。詳細は利用規約をご覧ください。