OPEN-SOURCE SCRIPT
Shock Detector: Price Jerk with Std-Dev Bands
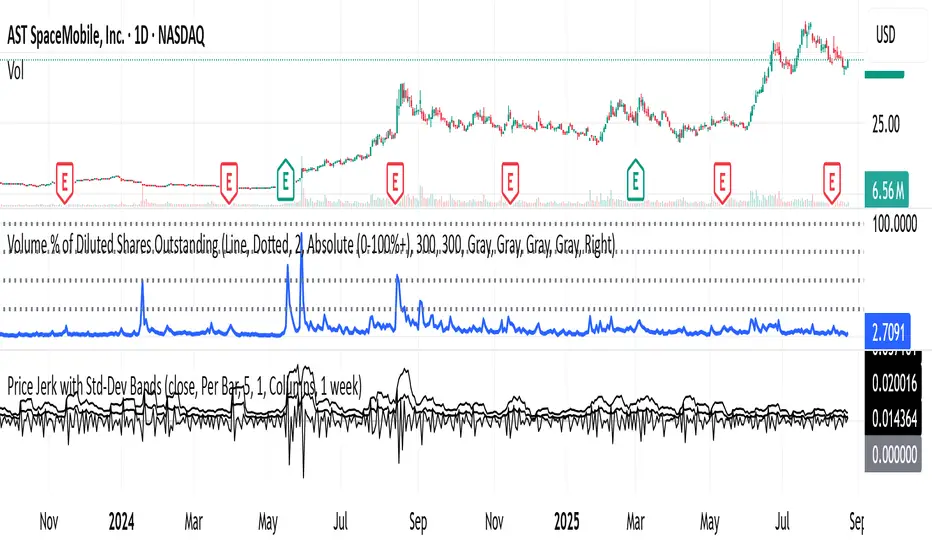
Detect sudden shocks in market behaviour
This indicator measures the jerk of price – the third derivative of price with respect to time (rate of change of acceleration). It highlights sudden accelerations and decelerations in price movement that are often invisible with standard momentum or volatility indicators.
Per-bar or time-scaled derivatives (choose whether calculations are based on bars or actual seconds).
Features
Log-price option for more stable readings across different price levels.
Optional smoothing with EMA to reduce noise.
Line or column view for flexible visualization.
Standard deviation bands (±1σ and ±2σ), centered either on zero or the rolling mean.
Auto window selection (1 day to 4 weeks), adaptive to chart timeframe.
Color-coded jerk: green for positive, red for negative.
Optional filled bands for easy visual context of normal vs. extreme jerk moves.
How to Use
Use jerk to identify sudden shifts in market dynamics, where price movement is not just changing direction but changing its acceleration.
Bands help highlight when jerk values are statistically unusual compared to recent history.
Combine with trend or momentum indicators for potential early warning of breakouts, reversals, or exhaustion.
Why it’s useful
Most indicators measure price, velocity (returns), or acceleration (momentum). This goes one step further to look at jerk, giving you a tool to spot “shock” movements in the market. By framing jerk within standard deviation bands, it’s easy to see whether current moves are ordinary or exceptional.
Developed with the assistance of ChatGPT (OpenAI).
オープンソーススクリプト
TradingViewの精神に則り、このスクリプトの作者はコードをオープンソースとして公開してくれました。トレーダーが内容を確認・検証できるようにという配慮です。作者に拍手を送りましょう!無料で利用できますが、コードの再公開はハウスルールに従う必要があります。
免責事項
この情報および投稿は、TradingViewが提供または推奨する金融、投資、トレード、その他のアドバイスや推奨を意図するものではなく、それらを構成するものでもありません。詳細は利用規約をご覧ください。
オープンソーススクリプト
TradingViewの精神に則り、このスクリプトの作者はコードをオープンソースとして公開してくれました。トレーダーが内容を確認・検証できるようにという配慮です。作者に拍手を送りましょう!無料で利用できますが、コードの再公開はハウスルールに従う必要があります。
免責事項
この情報および投稿は、TradingViewが提供または推奨する金融、投資、トレード、その他のアドバイスや推奨を意図するものではなく、それらを構成するものでもありません。詳細は利用規約をご覧ください。