OPEN-SOURCE SCRIPT
更新済 FAJ Dogepack

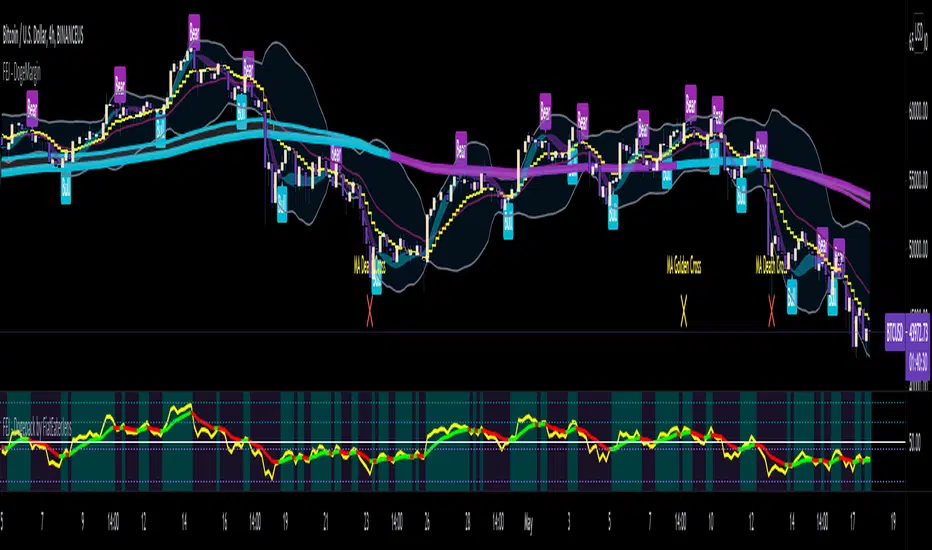
Combines EMA + RSI indicator
Dieses Script ist eine einfache Kombination aus RSI und EMA.
Es erlaubt euch zu erkennen in welche Richtung der Trend in dem aktuellen
TimeFrame geht und wie stark dieser aktuell ist.
Außerdem zeigt es euch ob gerade eher die Bullen oder die Bären den Markt
dominieren. Mit Hilfe des Indikators lassen sich Top und Bottom des aktuellen
Time Frames erkennen.
Ich Empfehle nur eine Nutzung bei BTC um Wellen besser zu erkennen.
Erinnert euch daran, das ist nur eine Beta und gibt immer noch viele Fehlsignale aus, also testet es für euch selber in verschiedenen TimeFrames.
This script is a simple combination of RSI and EMA.
It allows you to see in which direction the trend is going in the current
time frame and how strong it is currently. It also shows you whether the
bulls or the bears are dominating the market. With the help of the indicator,
the top and bottom of the current time frame can be recognized.
recommended only use in BTC to better detect waves.
remember that it is in beta and still sends many false signals so you have to test it well in several time periods.
リリースノート
Updatet Tags and Titleリリースノート
Beispieltrades auf dem 1W hinzugefügtAddet some examples on the 1W Chart
リリースノート
aリリースノート
Works best with my other two indicators "FEJ - DogeMargin" and "FEJ - DogeProtocol".Works best with my other two indicators "FEJ - DogeMargin" and "FEJ - DogeProtocol".
オープンソーススクリプト
TradingViewの精神に則り、このスクリプトの作者はコードをオープンソースとして公開してくれました。トレーダーが内容を確認・検証できるようにという配慮です。作者に拍手を送りましょう!無料で利用できますが、コードの再公開はハウスルールに従う必要があります。
免責事項
この情報および投稿は、TradingViewが提供または推奨する金融、投資、トレード、その他のアドバイスや推奨を意図するものではなく、それらを構成するものでもありません。詳細は利用規約をご覧ください。
オープンソーススクリプト
TradingViewの精神に則り、このスクリプトの作者はコードをオープンソースとして公開してくれました。トレーダーが内容を確認・検証できるようにという配慮です。作者に拍手を送りましょう!無料で利用できますが、コードの再公開はハウスルールに従う必要があります。
免責事項
この情報および投稿は、TradingViewが提供または推奨する金融、投資、トレード、その他のアドバイスや推奨を意図するものではなく、それらを構成するものでもありません。詳細は利用規約をご覧ください。