OPEN-SOURCE SCRIPT
更新済 Falcon Liquidity Grab Strategy
How to Use This Script for Commodities and Indices
Best Timeframes: Start with 15-minute charts but test on higher timeframes like 1 hour for indices.
Risk Settings: Adjust the stop_loss_points and take_profit_multiplier to match the volatility of the chosen instrument.
Best Timeframes: Start with 15-minute charts but test on higher timeframes like 1 hour for indices.
Risk Settings: Adjust the stop_loss_points and take_profit_multiplier to match the volatility of the chosen instrument.
リリースノート
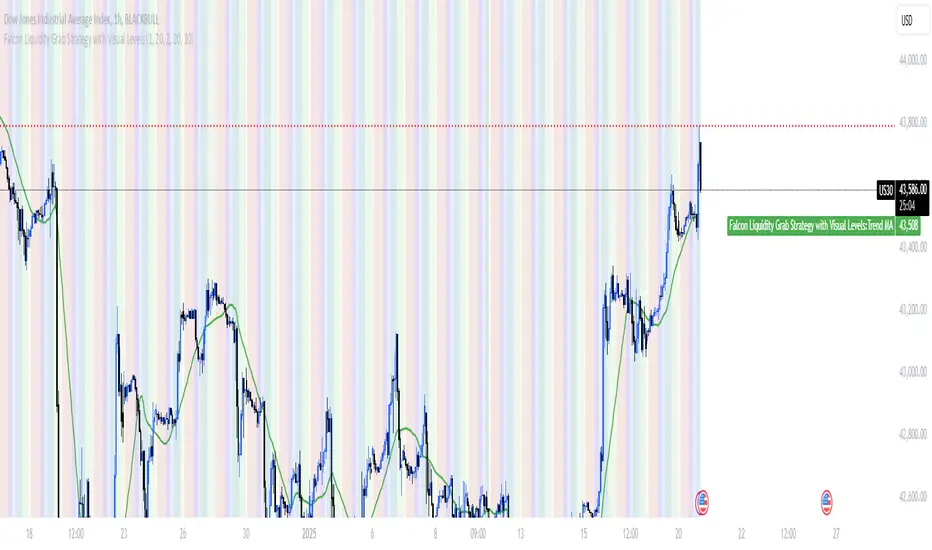
Explanation of AdditionsTake-Profit Levels (Green Dotted Lines):
A green dotted line is drawn at the take-profit level for both long and short trades.
These lines adjust dynamically based on the calculated take-profit level.
Stop-Loss Levels (Red Dotted Lines):
A red dotted line is drawn at the stop-loss level for both long and short trades.
These lines adjust dynamically based on the calculated stop-loss level.
Entry Level Block:
A solid blue line is drawn at the entry price to visually highlight where the trade begins.
Session Background Colors:
Session backgrounds remain the same to help contextualize the trades.
オープンソーススクリプト
TradingViewの精神に則り、このスクリプトの作者はコードをオープンソースとして公開してくれました。トレーダーが内容を確認・検証できるようにという配慮です。作者に拍手を送りましょう!無料で利用できますが、コードの再公開はハウスルールに従う必要があります。
免責事項
この情報および投稿は、TradingViewが提供または推奨する金融、投資、トレード、その他のアドバイスや推奨を意図するものではなく、それらを構成するものでもありません。詳細は利用規約をご覧ください。
オープンソーススクリプト
TradingViewの精神に則り、このスクリプトの作者はコードをオープンソースとして公開してくれました。トレーダーが内容を確認・検証できるようにという配慮です。作者に拍手を送りましょう!無料で利用できますが、コードの再公開はハウスルールに従う必要があります。
免責事項
この情報および投稿は、TradingViewが提供または推奨する金融、投資、トレード、その他のアドバイスや推奨を意図するものではなく、それらを構成するものでもありません。詳細は利用規約をご覧ください。